
Market Recap
On Thursday, US markets closed lower, led by steep declines in the tech sector. The Nasdaq broke key support, and the S&P 500 erased its post-election gains. Nvidia shares tumbled 8.5% after earnings, dragging the broader market down. Meanwhile, Trump confirmed that tariffs on Canada, Mexico, and China will take effect on March 4. Economic data showed slowing U.S. growth, with Q1 expected to cool further.
Trump’s tariff policy added to market uncertainty, creating confusion among investors. Initially, he announced a 25% tariff on imports from Canada and Mexico starting April 2, suggesting another one-month delay. However, on Truth Social, he later confirmed that the 25% tariffs will take effect on March 4, citing border security concerns. Additionally, he announced an extra 10% tariff on China, on top of the existing 10% duty.
Michael Brown, a senior strategist at Pepperstone, commented:
“We’re in a situation where traders are overwhelmed by news, unsure of what to focus on—especially with Trump. It’s difficult to tell what’s a negotiation tactic and what’s serious policy.”
US Markets Highlights
Tech Stocks Plunge
- Nvidia (-8.5%) | Market cap falls below $3T
- Broadcom (-7%) | Tesla (-3%) | Amazon, Google, Meta (-2%)
- Microsoft, Apple (-1%)
Semiconductors & Blockchain Stocks Fall
- Strategy (-8%) | ARM, ASML (-6%) | KLA, Canaan (-5%)
- AMD, Qualcomm (-4%) | Coinbase (-2%)
Defensive Sectors Rise
- Aerospace & Defense: Heico (+13%) | Raytheon (+2%)
- Real Estate & Insurance stocks climbed
Chinese Stocks Mostly Down
- Nasdaq Golden Dragon China Index: ▼ 0.93%
- Kingsoft Cloud (-13%) | Up Fintech (-5%)
- Li Auto (-3%) | Alibaba (-2%)
US Markets – Technical Analysis
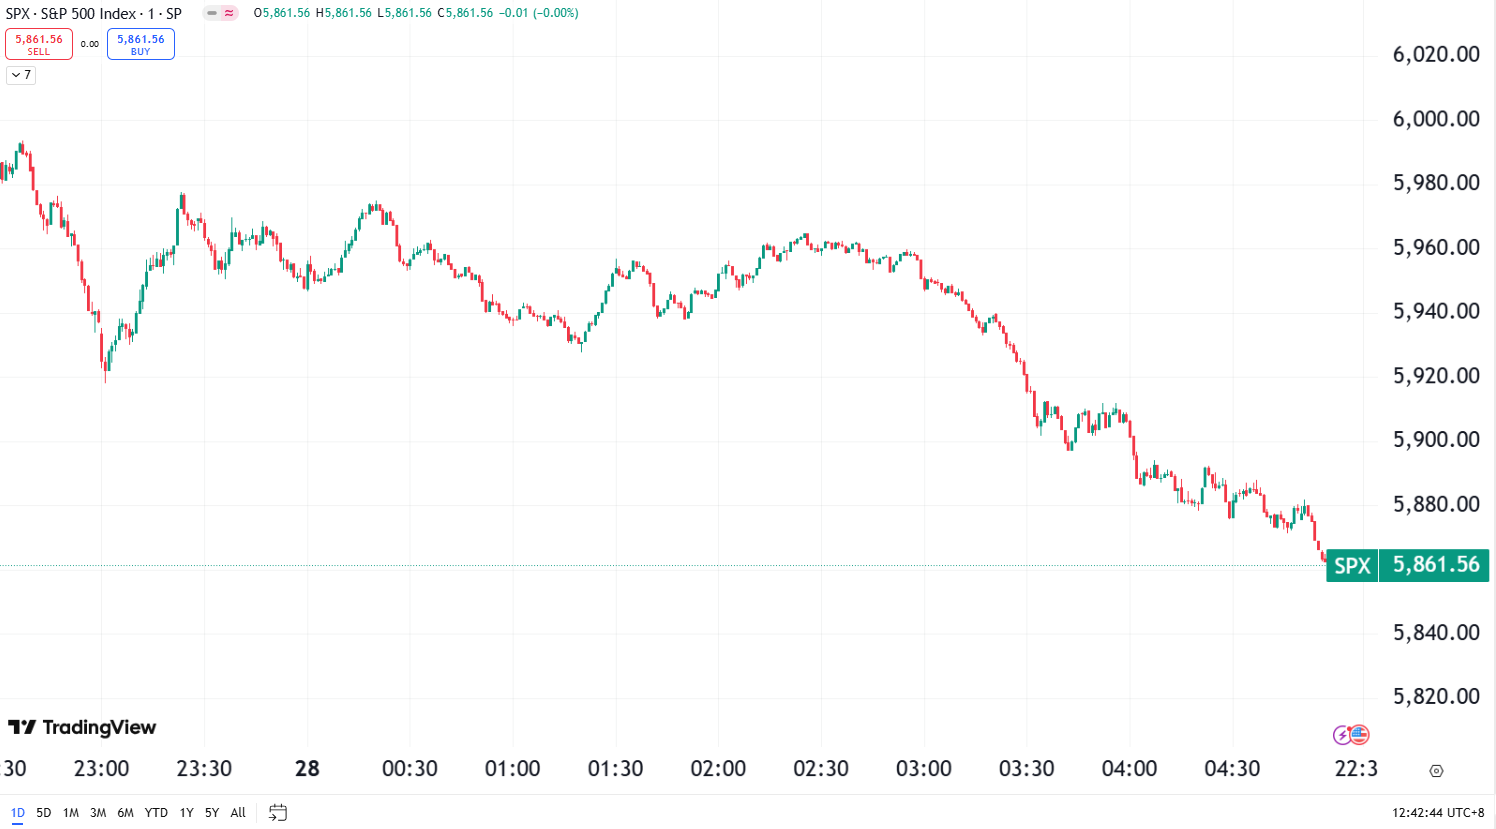
US Markets Performance
- Dow Jones: ▼ 193.62 pts (-0.45%) to 43,239.50
- Nasdaq: ▼ 530.84 pts (-2.78%) to 18,544.42
- S&P 500: ▼ 94.49 pts (-1.59%) to 5,861.57
Hong Kong Markets Surge as Alibaba Leads
Hong Kong stocks dropped across the board, with tech and crypto-related stocks leading declines.
- Tech Stocks Fall
- Lenovo, Alibaba, Meituan (-4%)
- Baidu, Kuaishou, Bilibili (-3%)
- EV Stocks Slump
- Li Auto (-6%)
- Crypto Stocks Hit Hard
- Meitu (-8%) as Bitcoin broke below $80K, its lowest since November, now down 27% from record highs as traders unwound post-election bets.
Hong Kong Market – Technical Analysis
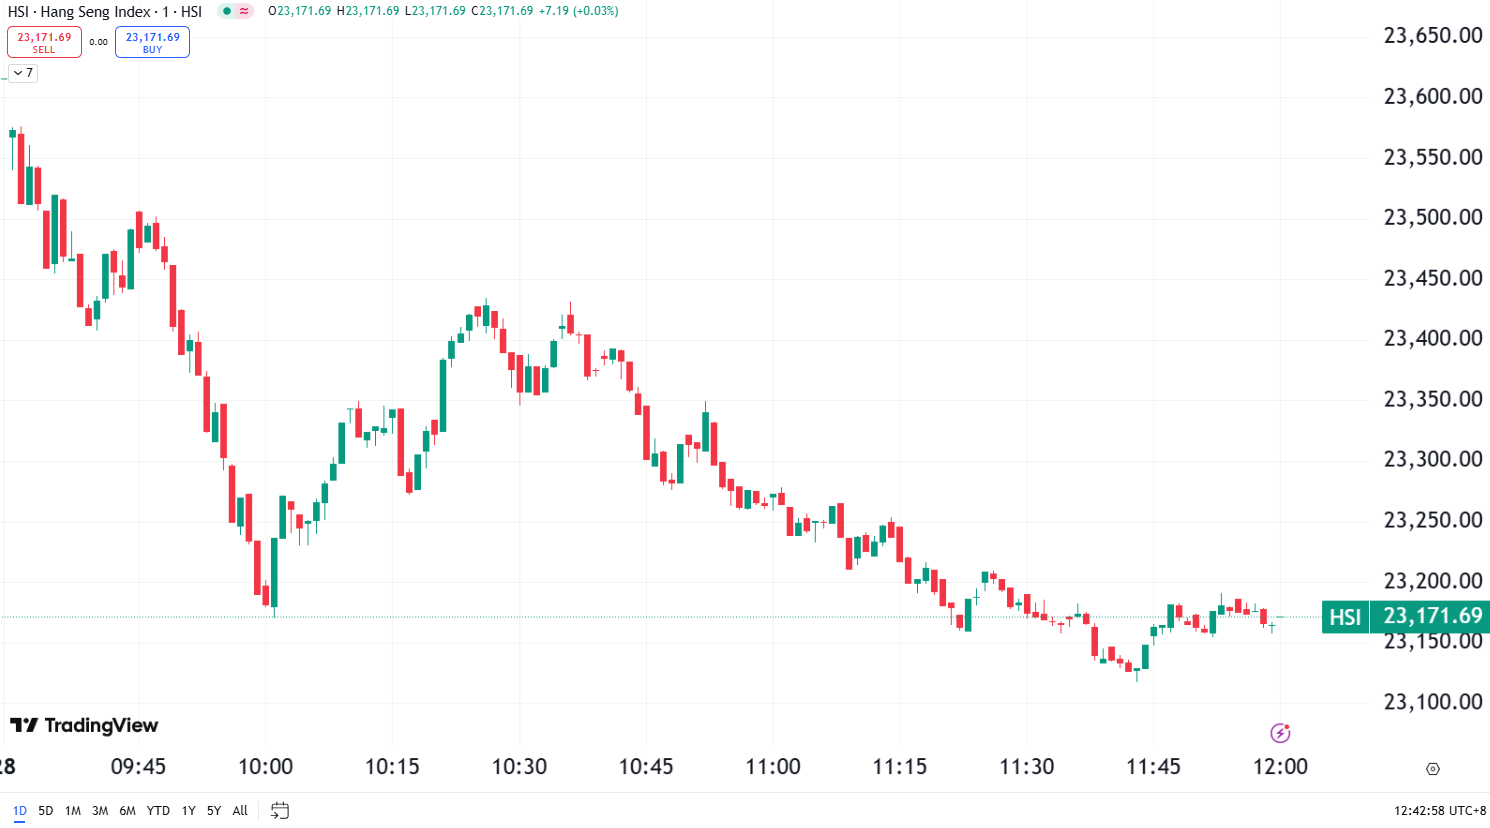
Hong Kong Market Performance
- Hang Seng Index: ▼ 2.30% to 23,171.69
- Hang Seng Tech Index: ▼ 3.78% to 5,658.79
- China Enterprises Index: ▼ 2.46% to 8,520.03
Mainland China Markets Highlights
Mainland Chinese stocks faced broad declines, with nearly 4,351 stocks falling and only 1,019 gaining.
- Top Gainers
- Processed foods, beverages, carbon trading, power tools, forestry
- Top Losers
- Robotics motors & controllers, AI chips, Apple desktop robots
China Markets – Technical Analysis
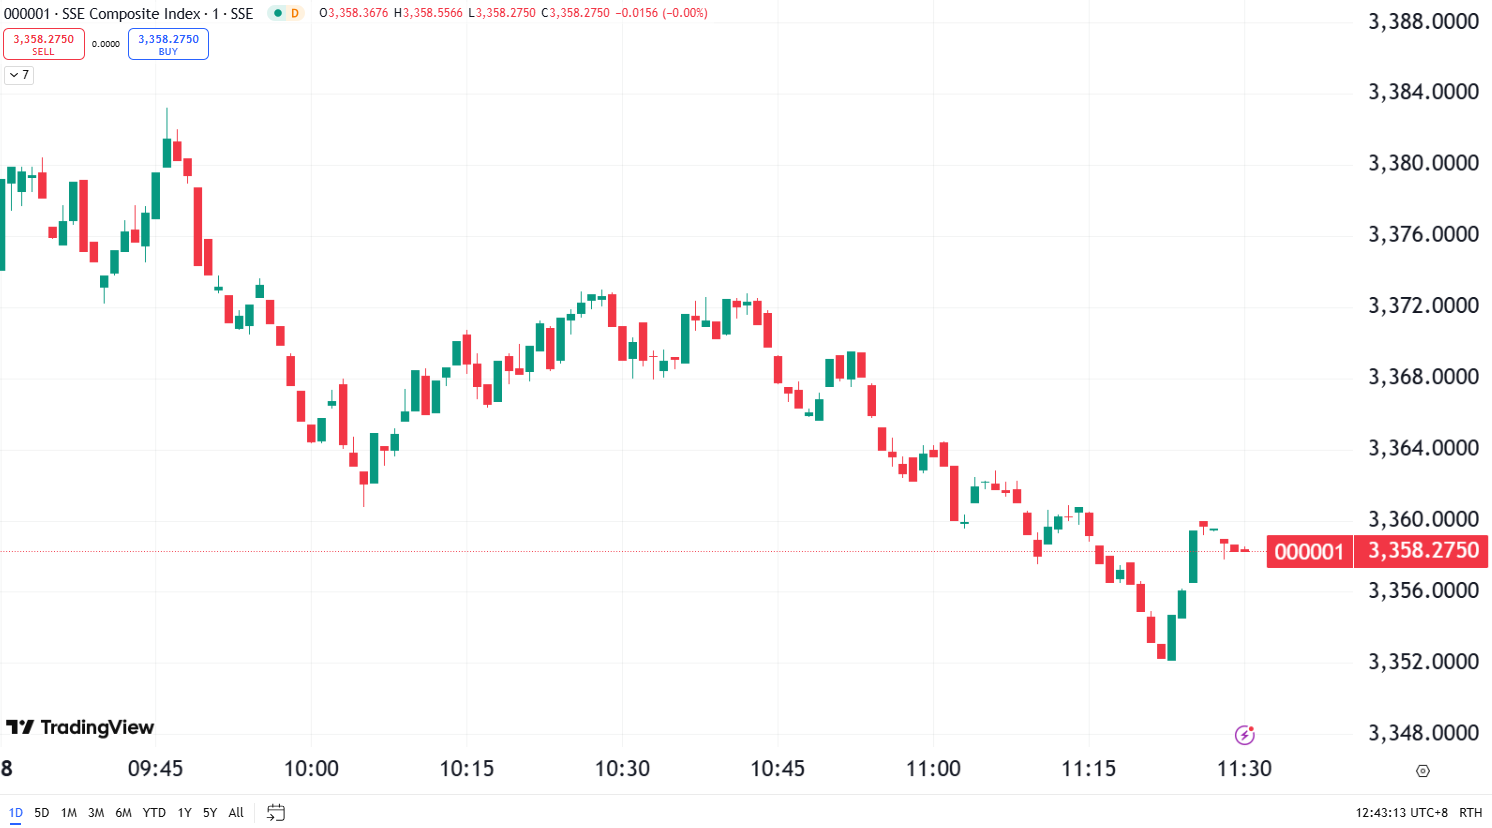
China Indices Performance
- Shanghai Composite: ▼ 0.88% to 3,358.28
- Shenzhen Component: ▼ 1.37% to 10,777.27
- ChiNext Index: ▼ 2.07% to 2,209.71
Risk Disclosure
Securities, Futures, CFDs and other financial products involve high risks due to the fluctuation in the value and prices of the underlying financial instruments. Due to the adverse and unpredictable market movements, large losses exceeding your initial investment could incur within a short period of time.
Please make sure you fully understand the risks of trading with the respective financial instrument before engaging in any transactions with us. You should seek independent professional advice if you do not understand the risks explained herein.
Disclaimer
This information contained in this blog is for general reference only and is not intended as investment advice, a recommendation, an offer, or an invitation to buy or sell any financial instruments. It does not consider any specific recipient’s investment objectives or financial situation. Past performance references are not reliable indicators of future performance. Doo Prime and its affiliates make no representations or warranties about the accuracy or completeness of this information and accept no liability for any losses or damages resulting from its use or from any investments made based on it.
The above information should not be used or considered as the basis for any trading decisions or as an invitation to engage in any transaction. Doo Prime does not guarantee the accuracy or completeness of this report and assumes no responsibility for any losses resulting from the use of this report. Do not rely on this report to replace your independent judgment. The market is risky, and investments should be made with caution.