

1. Daily technical analysis of selected currency pairs
AUD/JPY Bullish
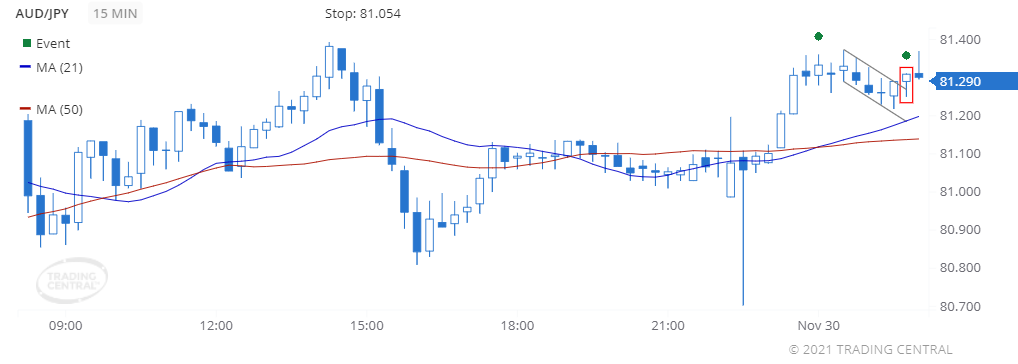
Image Features: forms “Hammer (Bullish)” pattern
Target
Opportunity recognized 2021 Nov 30 for the period of up to 12 hours
-0.019 (1.9 pips) price change since the Technical Event at 81.309
Technical Analysis
We found a pattern called Hammer on 2021 Nov 30 at 01:45 GMT on a 15 minute chart suggesting the outlook is bullish for up to 12 hours.
The faster moving average crossed above the slower moving average on 2021 Nov 30 at 00:00 GMT, signaling a new uptrend has been established.
EUR/JPY Bullish
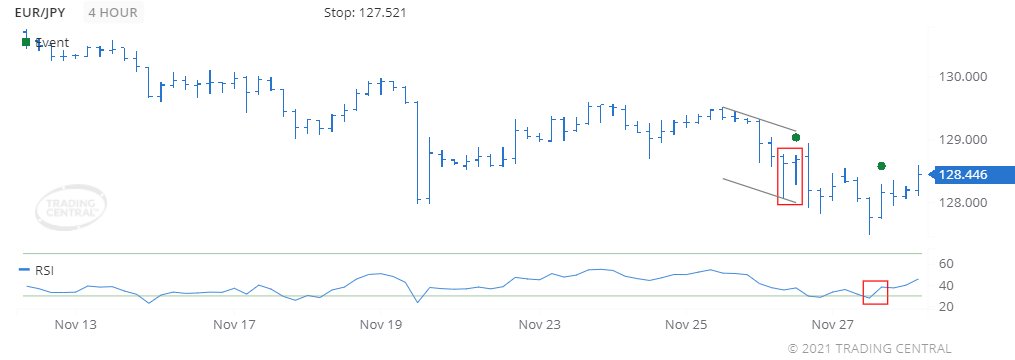
Image Features: forms “Inside Bar (Bullish)” pattern
Target
Opportunity recognized 2021 Nov 26 for the period of up to 48 hours
-0.234 (23.4 pips) price change since the Technical Event at 128.680
Technical Analysis
We found a pattern called Inside Bar (Bullish) on 2021 Nov 26 at 13:00 GMT on a 4 hour chart suggesting the outlook is bullish for up to 48 hours.
The RSI rose above 30 on 2021 Nov 29 at 13:00 GMT, telling us the price is starting to recover from being oversold.
2. Daily Analyst’s View
EUR/USD
may rise 21 – 41 pips
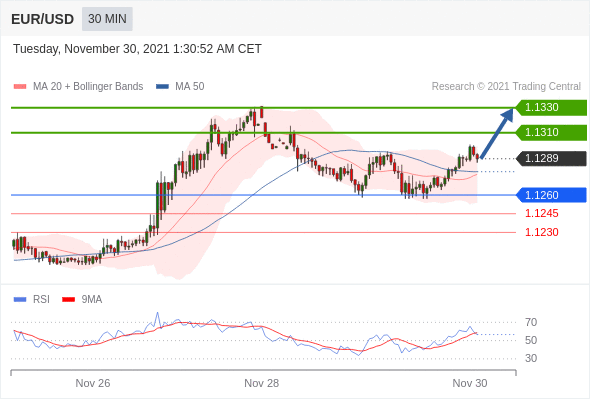
Pivot
1.1260
Our preference
Long positions above 1.1260 with targets at 1.1310 & 1.1330 in extension.
Alternative scenario
Below 1.1260 look for further downside with 1.1245 & 1.1230 as targets.
Comment
The RSI calls for a rebound.
GBP/USD
may fall 27 – 37 pips
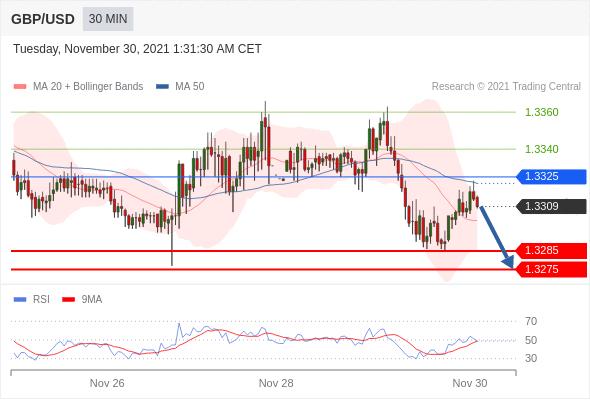
Pivot
1.3325
Our preference
Short positions below 1.3325 with targets at 1.3285 & 1.3275 in extension.
Alternative scenario
Above 1.3325 look for further upside with 1.3340 & 1.3360 as targets.
Comment
The upward potential is likely to be limited by the resistance at 1.3325.
USD/CAD
may fall 29 – 64 pips
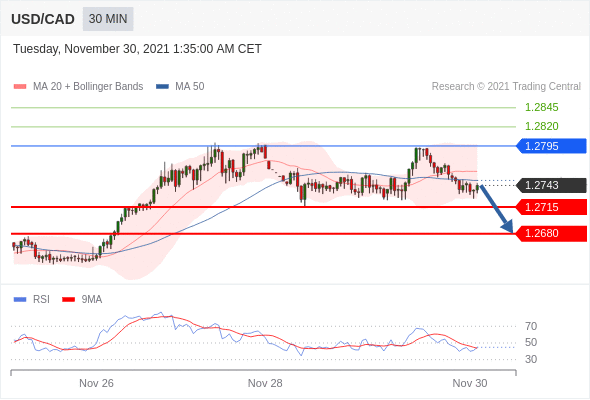
Pivot
1.2795
Our preference
Short positions below 1.2795 with targets at 1.2715 & 1.2680 in extension.
Alternative scenario
Above 1.2795 look for further upside with 1.2820 & 1.2845 as targets.
Comment
The RSI lacks upward momentum.
Gold
may fall to 1772.00 – 1779.00
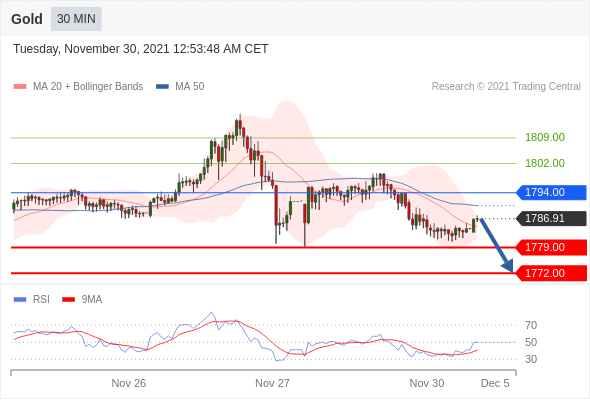
Pivot
1794.00
Our preference
Short positions below 1794.00 with targets at 1779.00 & 1772.00 in extension.
Alternative scenario
Above 1794.00 look for further upside with 1802.00 & 1809.00 as targets.
Comment
The RSI is mixed with a bearish bias.
Crude Oil (WTI)
may rise to 72.90 – 74.25
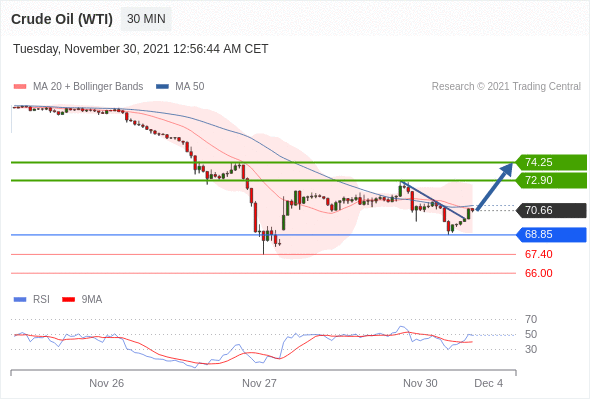
Pivot
68.85
Our preference
Long positions above 68.85 with targets at 72.90 & 74.25 in extension.
Alternative scenario
Below 68.85 look for further downside with 67.40 & 66.00 as targets.
Comment
The RSI calls for a bounce.
S&P 500 (CME)
may rise to 4688.00 – 4716.00
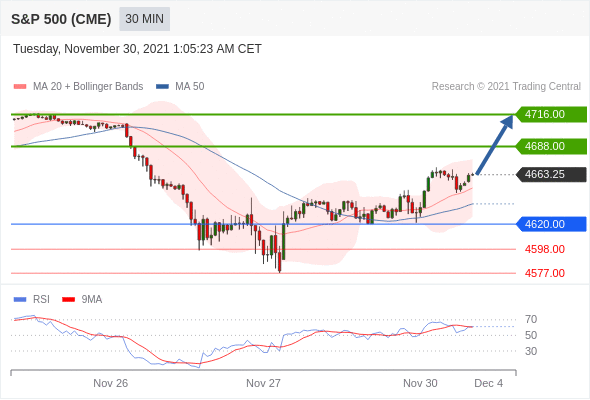
Pivot
4620.00
Our preference
Long positions above 4620.00 with targets at 4688.00 & 4716.00 in extension.
Alternative scenario
Below 4620.00 look for further downside with 4598.00 & 4577.00 as targets.
Comment
The RSI is bullish and calls for further upside.
Nasdaq 100 (CME)
may rise to 16580.00 – 16680.00
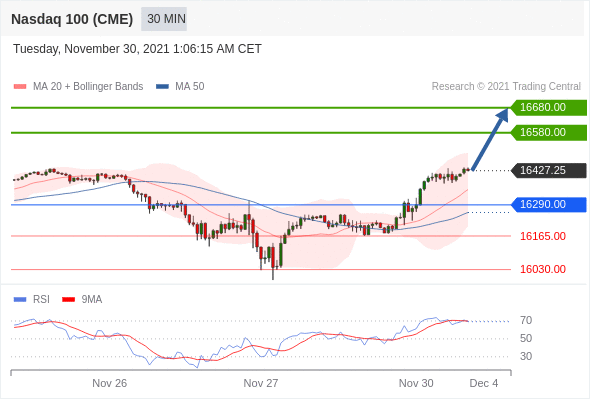
Pivot
16290.00
Our preference
Long positions above 16290.00 with targets at 16580.00 & 16680.00 in extension.
Alternative scenario
Below 16290.00 look for further downside with 16165.00 & 16030.00 as targets.
Comment
The RSI shows upside momentum.
Hang Seng (HKFE)
may fall to 23430.00 – 23600.00
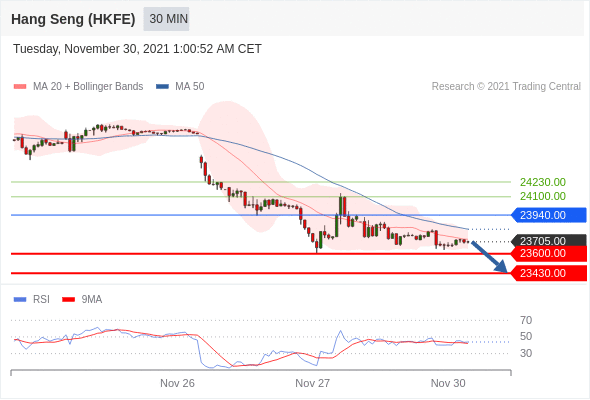
Pivot
23940.00
Our preference
Short positions below 23940.00 with targets at 23600.00 & 23430.00 in extension.
Alternative scenario
Above 23940.00 look for further upside with 24100.00 & 24230.00 as targets.
Comment
The RSI is below its neutrality area at 50%.
Disclaimer:
This report is prepared and published by Trading Central for all clients of Doo Prime. As a third-party indicator tool, Trading Central is only for your strategic reference during the investment process and does not constitute advice or a recommendation by Doo Prime or Trading Central. Neither Doo Prime nor Trading Central are responsible to bear the relevant legal liabilities for the investment risks arising from your use of this report to make buying and selling decisions.