

1. Daily technical analysis of selected currency pairs
AUD/JPY Bullish
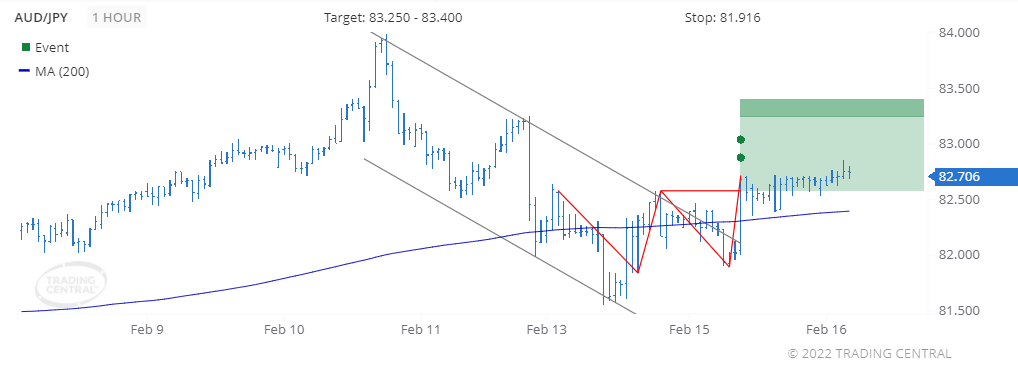
Image Features: forms “Double Bottom (Bullish)” pattern
Target
Opportunity recognized 2022 Feb 15 for the period of up to 2 weeks
+0.126 (12.6 pips) price change since the Technical Event at 82.580
Technical Analysis
We found a pattern called Double Bottom on 2022 Feb 15 at 09:00 GMT on a 1 hour chart, providing a target price for up to 2 weeks in the range of 83.250 to 83.400.
The price crossed above its moving average on 2022 Feb 15 at 09:00 GMT signaling a new uptrend has been established.
CAD/JPY Bullish
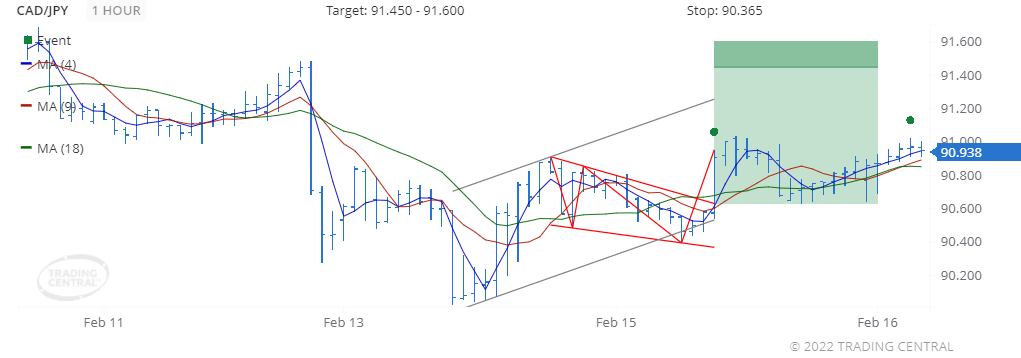
Image Features: forms “Flag (Bullish)” pattern
Target
Opportunity recognized 2022 Feb 15 for the period of up to 48 hours
+0.306 (30.6 pips) price change since the Technical Event at 90.632
Technical Analysis
We found a pattern called Flag (Bullish) on 2022 Feb 15 at 09:00 GMT on a 1 hour chart, providing a target price for up to 48 hours in the range of 91.450 to 91.600.
On 2022 Feb 16 at 03:00 GMT, the 4-bar Moving Average crossed above the 9-bar MA which crossed above the 18-bar MA, signaling a new uptrend has been established.
2. Daily Analyst’s View
EUR/USD
may rise 19 – 34 pips
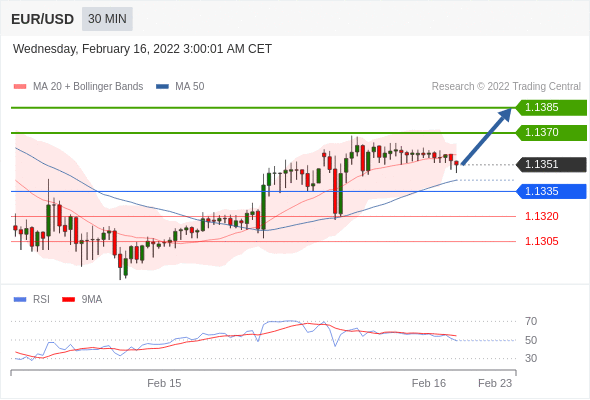
Pivot
1.1335
Our preference
Long positions above 1.1335 with targets at 1.1370 & 1.1385 in extension.
Alternative scenario
Below 1.1335 look for further downside with 1.1320 & 1.1305 as targets.
Comment
Even though a continuation of the consolidation cannot be ruled out, its extent should be limited.
GBP/USD
may rise 11 – 21 pips
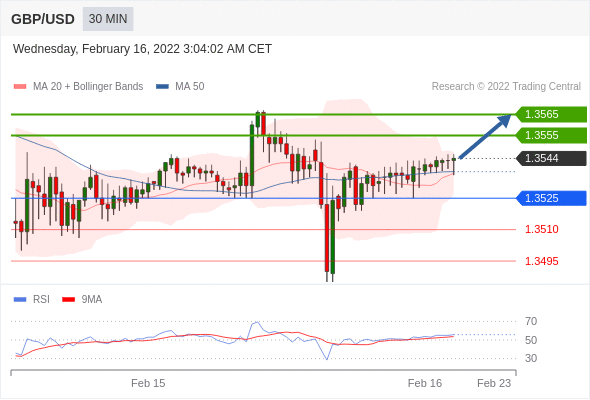
Pivot
1.3525
Our preference
Long positions above 1.3525 with targets at 1.3555 & 1.3565 in extension.
Alternative scenario
Below 1.3525 look for further downside with 1.3510 & 1.3495 as targets.
Comment
The RSI lacks downward momentum.
USD/CAD
may fall 15 – 35 pips
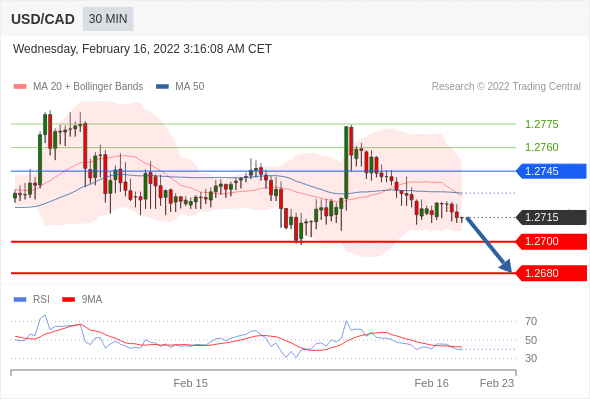
Pivot
1.2745
Our preference
Short positions below 1.2745 with targets at 1.2700 & 1.2680 in extension.
Alternative scenario
Above 1.2745 look for further upside with 1.2760 & 1.2775 as targets.
Comment
The RSI shows downside momentum.
Gold
may fall to 1832.00 – 1843.00
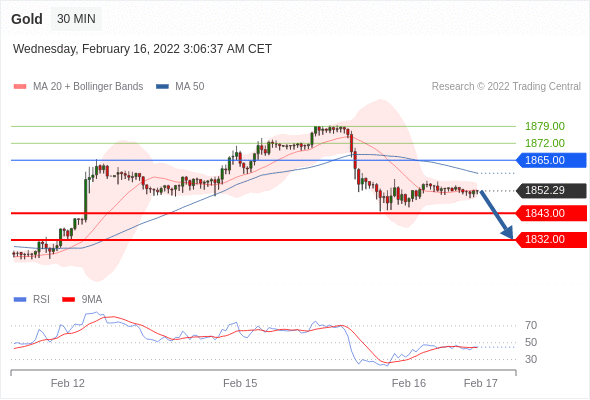
Pivot
1865.00
Our preference
Short positions below 1865.00 with targets at 1843.00 & 1832.00 in extension.
Alternative scenario
Above 1865.00 look for further upside with 1872.00 & 1879.00 as targets.
Comment
As long as the resistance at 1865.00 is not surpassed, the risk of the break below 1843.00 remains high.
Crude Oil (WTI)
may fall to 89.95 – 90.65
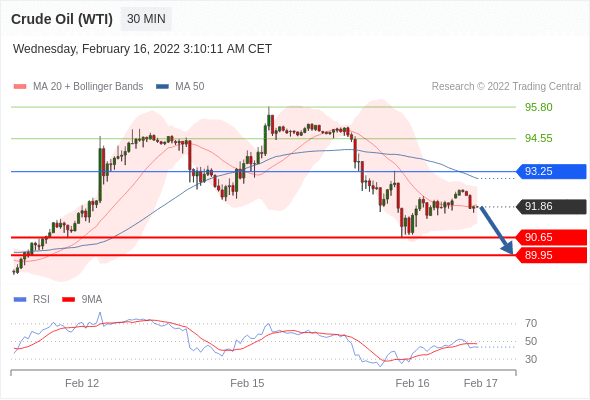
Pivot
93.25
Our preference
Short positions below 93.25 with targets at 90.65 & 89.95 in extension.
Alternative scenario
Above 93.25 look for further upside with 94.55 & 95.80 as targets.
Comment
The RSI has just struck against its neutrality area at 50% and is reversing down.
S&P 500 (CME)
may rise to 4502.00 – 4550.00
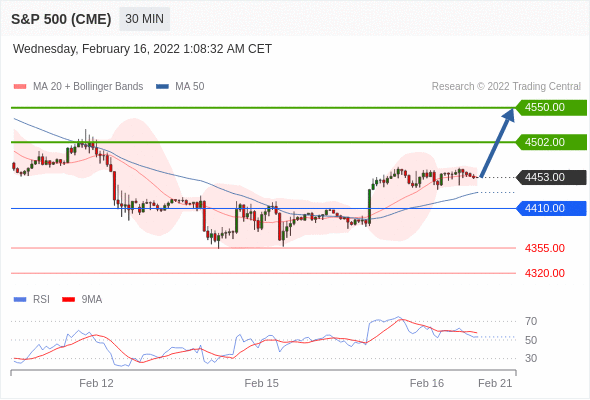
Pivot
4410.00
Our preference
Long positions above 4410.00 with targets at 4502.00 & 4550.00 in extension.
Alternative scenario
Below 4410.00 look for further downside with 4355.00 & 4320.00 as targets.
Comment
The RSI is mixed with a bullish bias.
Nasdaq 100 (CME)
may rise to 14740.00 – 14870.00
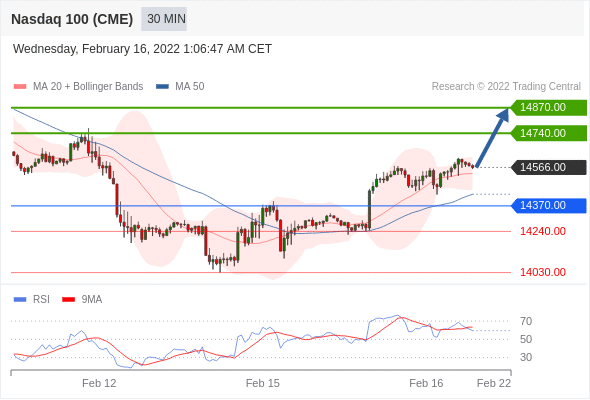
Pivot
14370.00
Our preference
Long positions above 14370.00 with targets at 14740.00 & 14870.00 in extension.
Alternative scenario
Below 14370.00 look for further downside with 14240.00 & 14030.00 as targets.
Comment
The RSI is mixed to bullish.
Hang Seng (HKFE)
may rise to 24760.00 – 24980.00
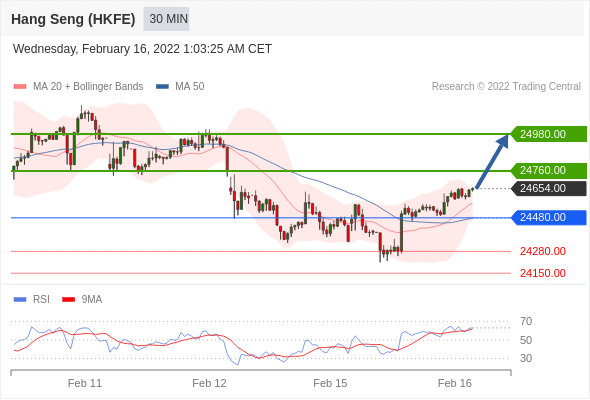
Pivot
24480.00
Our preference
Long positions above 24480.00 with targets at 24760.00 & 24980.00 in extension.
Alternative scenario
Below 24480.00 look for further downside with 24280.00 & 24150.00 as targets.
Comment
The RSI shows upside momentum.
Disclaimer:
This report is prepared and published by Trading Central for all clients of Doo Prime. As a third-party indicator tool, Trading Central is only for your strategic reference during the investment process and does not constitute advice or a recommendation by Doo Prime or Trading Central. Neither Doo Prime nor Trading Central are responsible to bear the relevant legal liabilities for the investment risks arising from your use of this report to make buying and selling decisions.