

1. Daily technical analysis of selected currency pairs
AUD/JPY Bearish
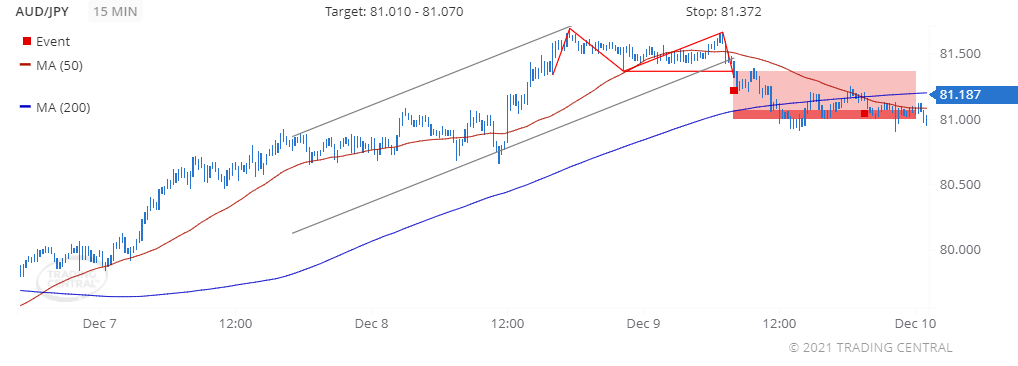
Image Features: forms “Double Top (Bearish)” pattern
Target
Opportunity recognized 2021 Dec 09 for the period of up to 48 hours
-0.181 (18.1 pips) price change since the Technical Event at 81.368
Technical Analysis
We found a pattern called Double Top on 2021 Dec 09 at 08:00 GMT on a 15 minute chart, providing a target price for up to 48 hours in the range of 81.010 to 81.070.
The faster moving average crossed below the slower moving average on 2021 Dec 09 at 19:30 GMT, signaling a new downtrend has been established.
CAD/JPY Bullish
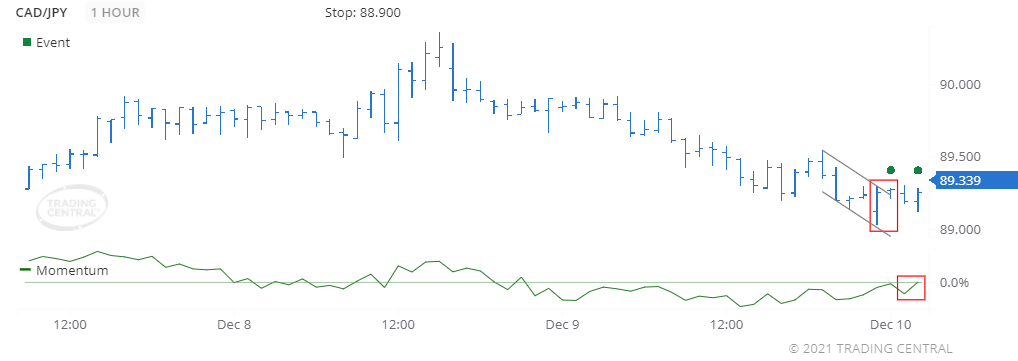
Image Features: forms “Inside Bar (Bullish)” pattern
Target
Opportunity recognized 2021 Dec 10 for the period of up to 12 hours
+0.065 (6.5 pips) price change since the Technical Event at 89.274
Technical Analysis
We found a pattern called Inside Bar (Bullish) on 2021 Dec 10 at 00:00 GMT on a 1 hour chart suggesting the outlook is bullish for up to 12 hours.
The Momentum oscillator crossed above 0 on 2021 Dec 10 at 02:00 GMT, thereby signaling a new accelerating uptrend.
2. Daily Analyst’s View
EUR/USD
may fall 17 – 37 pips
Pivot
1.1315
Our preference
Short positions below 1.1315 with targets at 1.1275 & 1.1255 in extension.
Alternative scenario
Above 1.1315 look for further upside with 1.1335 & 1.1355 as targets.
Comment
Even though a continuation of the technical rebound cannot be ruled out, its extent should be limited.
GBP/USD
may rise 18 – 38 pips
Pivot
1.3200
Our preference
Long positions above 1.3200 with targets at 1.3240 & 1.3260 in extension.
Alternative scenario
Below 1.3200 look for further downside with 1.3185 & 1.3170 as targets.
Comment
The RSI has just landed on its neutrality area at 50% and is turning up.
USD/CAD
may rise 18 – 43 pips
Pivot
1.2680
Our preference
Long positions above 1.2680 with targets at 1.2725 & 1.2750 in extension.
Alternative scenario
Below 1.2680 look for further downside with 1.2660 & 1.2640 as targets.
Comment
Technically the RSI is above its neutrality area at 50.
Gold
may fall to 1765.00 – 1772.00
Pivot
1783.00
Our preference
Short positions below 1783.00 with targets at 1772.00 & 1765.00 in extension.
Alternative scenario
Above 1783.00 look for further upside with 1788.00 & 1793.00 as targets.
Comment
The RSI is mixed to bearish.
Crude Oil (WTI)
may fall to 68.85 – 69.75
Pivot
71.80
Our preference
Short positions below 71.80 with targets at 69.75 & 68.85 in extension.
Alternative scenario
Above 71.80 look for further upside with 72.50 & 73.30 as targets.
Comment
The RSI shows downside momentum.
S&P 500 (CME)
may fall to 4608.00 – 4635.00
Pivot
4687.00
Our preference
Short positions below 4687.00 with targets at 4635.00 & 4608.00 in extension.
Alternative scenario
Above 4687.00 look for further upside with 4704.00 & 4726.00 as targets.
Comment
The RSI is bearish and calls for further downside.
Nasdaq 100 (CME)
may fall to 15850.00 – 15990.00
Pivot
16305.00
Our preference
Short positions below 16305.00 with targets at 15990.00 & 15850.00 in extension.
Alternative scenario
Above 16305.00 look for further upside with 16435.00 & 16570.00 as targets.
Comment
The RSI has broken down its 30 level.
Hang Seng (HKFE)
may rise to 24280.00 – 24450.00
Pivot
23910.00
Our preference
Long positions above 23910.00 with targets at 24280.00 & 24450.00 in extension.
Alternative scenario
Below 23910.00 look for further downside with 23695.00 & 23500.00 as targets.
Comment
The next resistances are at 24280.00 and then at 24450.00.
Disclaimer:
This report is prepared and published by Trading Central for all clients of Doo Prime. As a third-party indicator tool, Trading Central is only for your strategic reference during the investment process and does not constitute advice or a recommendation by Doo Prime or Trading Central. Neither Doo Prime nor Trading Central are responsible to bear the relevant legal liabilities for the investment risks arising from your use of this report to make buying and selling decisions.