

Market Recap
On Wednesday, US markets ended mixed, with the Nasdaq and S&P 500 declining for the fourth consecutive session. Tesla plunged over 8%, bringing its market cap below $1 trillion. Market sentiment weakened as U.S. consumer confidence posted its steepest drop in nearly four years. Investors remain wary of policy uncertainties under Trump’s administration and their potential impact on global economic growth.
Economic data showed further signs of a slowdown. The Philadelphia Fed’s Business Outlook Survey recorded a decline in February:
- Business Activity Index: -12.9 (previously 2.2)
- New Orders Index: -1.3 (previously 1.6)
- Prices Paid Index: 23.4 (previously 28.9)
- Full-Time Employment Index: 2.5 (previously 1.5)
- Wage & Benefits Cost Index: 25.3 (previously 24.5)
The Conference Board reported a 7% drop in U.S. consumer confidence for February, falling to 98.3—below the expected 102.3—further signaling economic concerns. Investors are now looking ahead to Friday’s PCE Price Index, the Fed’s preferred inflation gauge.
US Markets Highlights
Tech Stocks Decline:
- Tesla (-8%) | Nvidia, Google (-2%) | Microsoft, Meta (-1%)
- Semiconductor, cryptocurrency, and EV stocks led the declines
- Canaan (-16%) | Strategy (-11%) | Coinbase (-6%) | Rivian (-4%)
Chinese Stocks Rebound:
- Nasdaq Golden Dragon China Index +0.58%
- Li Auto (+13%) | XPeng (+5%) | Alibaba, Bilibili (+4%) | JD.com, Kingsoft Cloud (+2%)
US Markets – Technical Analysis
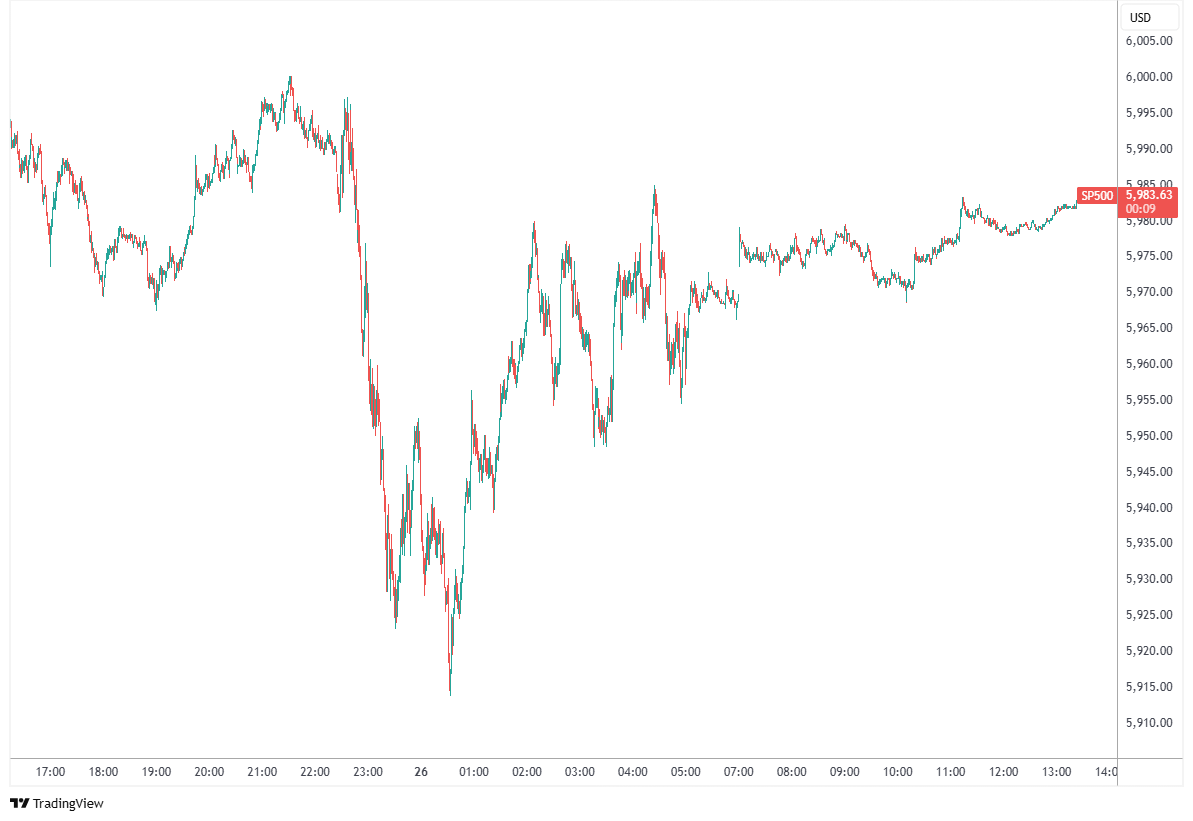
US Markets Performance
- Dow Jones: ▲ 159.95 pts (+0.37%) to 43,621.16
- Nasdaq: ▼ 260.54 pts (-1.35%) to 19,026.39
- S&P 500: ▼ 28.00 pts (-0.47%) to 5,955.25
Hong Kong Markets Surge as Alibaba Leads
Hong Kong stocks opened higher, driven by gains in tech and real estate sectors:
- Tech Stocks: JD.com +7%, Meituan +6%, Alibaba, Bilibili +4%, Xiaomi, Tencent +3%
- Real Estate Stocks: Shimao Group +13%
- CXO Biotech Stocks: Joincare Pharmaceutical +10%
Hong Kong Market – Technical Analysis
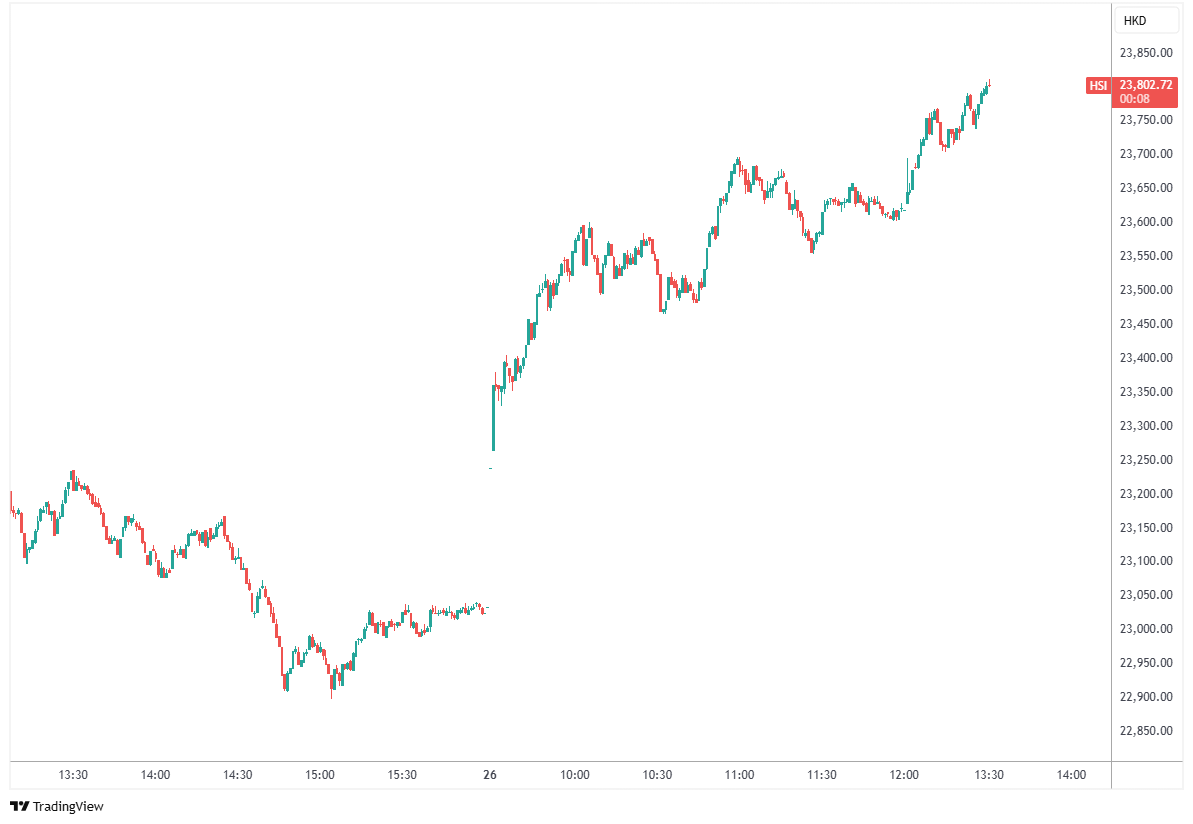
Hong Kong Market Performance
- Hang Seng Index: ▲ 2.54% to 23,619.24
- Hang Seng Tech Index: ▲ 3.69% to 5,909.26
- China Enterprises Index: ▲ 2.63% to 8,722.93
Mainland China Markets Highlights
A-shares opened higher and extended gains throughout the session, with over 3,800 stocks advancing. Sector highlights:
Gainers:
- Robotics, Harmonic Drives, Precision Machinery surged
- Auto Sector: Li Auto +12%, Great Wall Motors limit-up
Losers:
- Healthcare, Vaccine-related stocks declined
- Agriculture stocks underperformed
China Markets – Technical Analysis
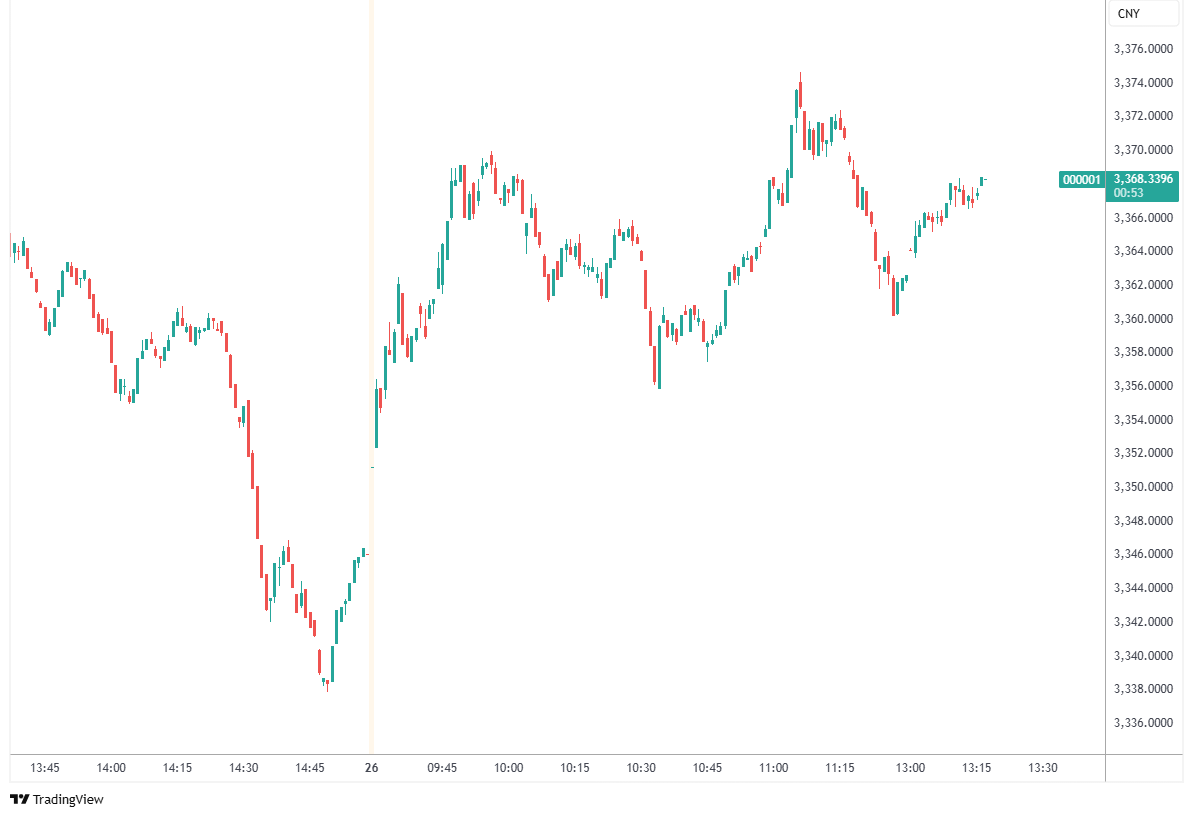
China Indices Performance
- Shanghai Composite: ▲ 0.5% to 3,362.63
- Shenzhen Component: ▲ 0.24% to 10,880.35
- ChiNext Index: ▲ 0.26% to 2,246.43
Risk Disclosure
Securities, Futures, CFDs and other financial products involve high risks due to the fluctuation in the value and prices of the underlying financial instruments. Due to the adverse and unpredictable market movements, large losses exceeding your initial investment could incur within a short period of time.
Please make sure you fully understand the risks of trading with the respective financial instrument before engaging in any transactions with us. You should seek independent professional advice if you do not understand the risks explained herein.
Disclaimer
This information contained in this blog is for general reference only and is not intended as investment advice, a recommendation, an offer, or an invitation to buy or sell any financial instruments. It does not consider any specific recipient’s investment objectives or financial situation. Past performance references are not reliable indicators of future performance. Doo Prime and its affiliates make no representations or warranties about the accuracy or completeness of this information and accept no liability for any losses or damages resulting from its use or from any investments made based on it.
The above information should not be used or considered as the basis for any trading decisions or as an invitation to engage in any transaction. Doo Prime does not guarantee the accuracy or completeness of this report and assumes no responsibility for any losses resulting from the use of this report. Do not rely on this report to replace your independent judgment. The market is risky, and investments should be made with caution.

