


Rising rates, softer hiring and a stronger AI cycle shape the Q4 2026 market outlook, putting yields, oil, Japan and AI guidance in focus.
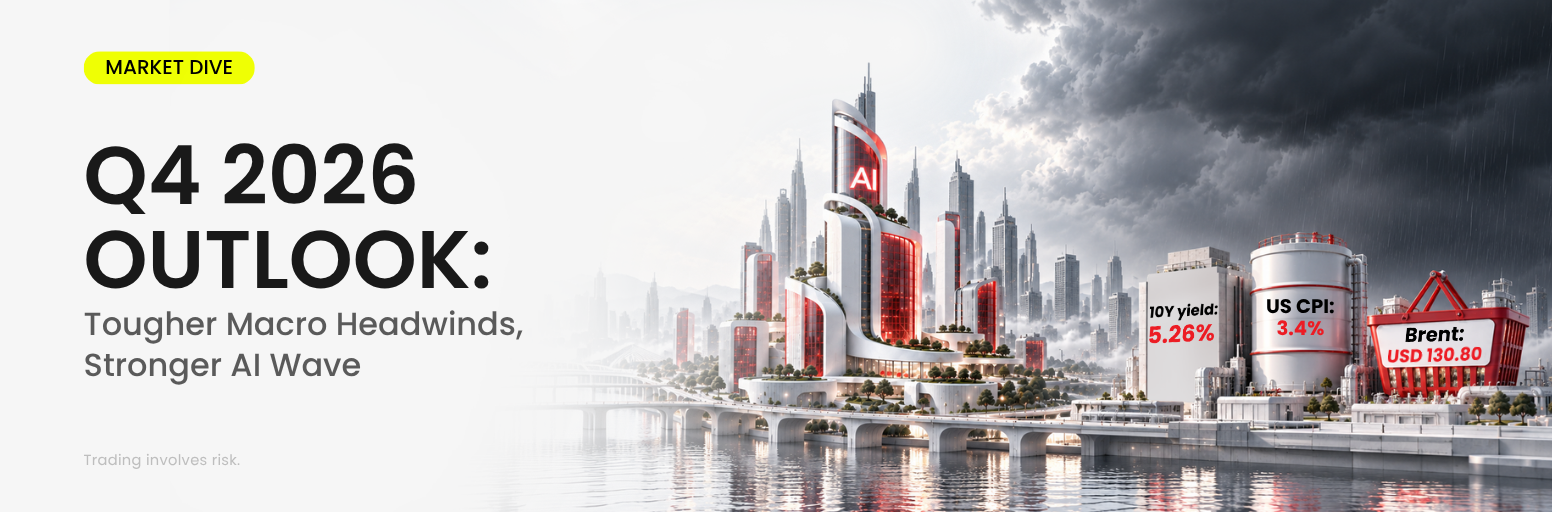
Q4 is beginning with an unusual contradiction.
Central banks are tightening again. US Treasury yields are above 5%. Inflation pressure remains stubborn, and energy markets are still being shaped by geopolitical risk.
Yet the picture underneath is not moving in one direction.
September business surveys recorded the fastest expansion in US activity in more than five years. Within two weeks, hiring stalled and growth estimates were cut. Through all of it, AI investment, computing demand and technology exports kept accelerating.
That sets up D Prime’s theme for the fourth quarter:
Tougher Macro Headwinds. Stronger AI Wave.
On one side, a higher global cost of capital is becoming harder for markets to ignore.
On the other, AI continues to generate investment, productivity expectations and earnings momentum strong enough to support parts of the economy despite tighter financial conditions.
The question for Q4 is which force becomes more powerful.
Global Central Banks Are Turning Tighter Again
The monetary-policy backdrop has changed quickly.
Three Hikes, Three Different Cycles
Three of the world’s major central banks raised rates within weeks of each other in September. The Federal Reserve moved to 3.75%-4.00% on September 16, its first hike since July 2023. The ECB reached a 2.50% deposit rate on September 10. The Bank of Japan is now at 1.25%.
We covered those three decisions, the divergence between them and what the shift means for Treasuries, equities, the dollar and gold in Fed, ECB and BOJ Hike Rates: Is Higher for Longer the New Global Regime?. This outlook starts where that piece left off and asks what happens from here.
Three different starting points, three different inflation problems, three different speeds. This is not a synchronized hiking cycle.
But one conclusion is clear:
The era of synchronized easing is over.
Where Do Rates Ultimately Settle?
The more difficult question is where rates settle.
That turns on the neutral rate, or r-star: the real short-term rate consistent with an economy running near potential while inflation stays stable. It cannot be observed directly, only estimated, which is why confident claims that policy is “too tight” or “too loose” should be treated carefully. We argued in September that strong productivity and capital investment may have pushed r-star higher, which would make current policy less restrictive than the headline rate suggests.
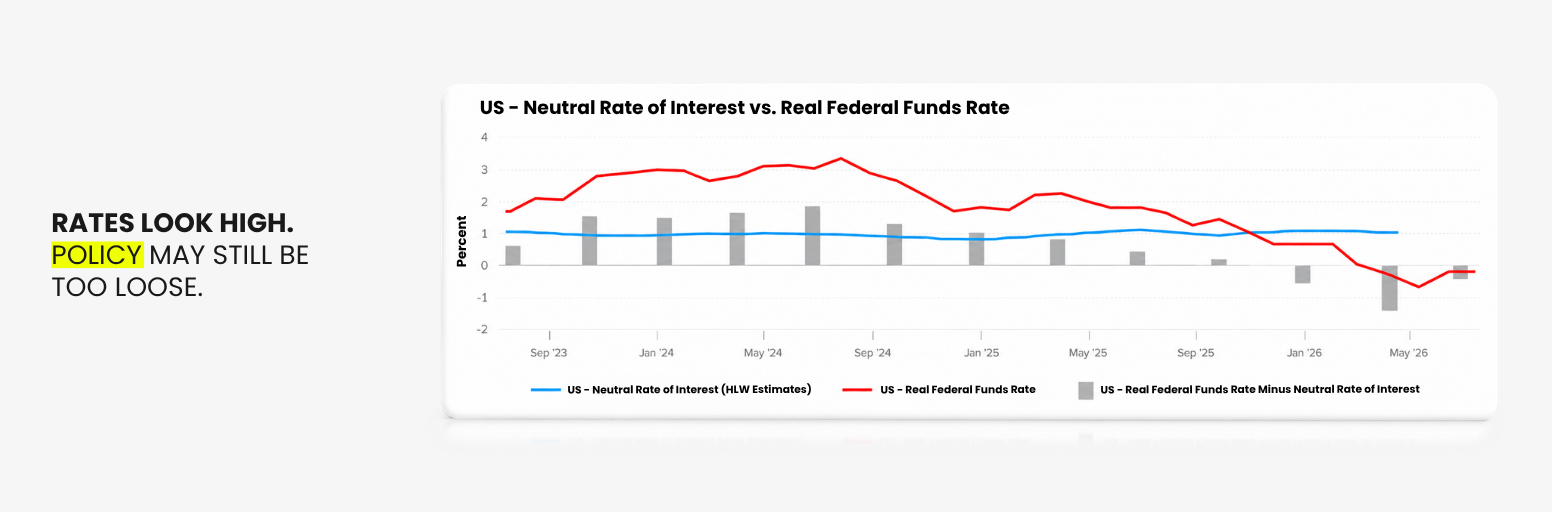
A more practical signal comes from the Fed itself. Its September projections put the median policy rate at 4.1% at the end of 2026, which leaves room for one more 25-basis-point increase without implying a run of back-to-back hikes.
D Prime’s base case is therefore higher for longer, rather than an uninterrupted hiking cycle.
Another hike remains possible if inflation stays sticky. Two or more additional increases would likely require a renewed deterioration in inflation or another significant energy shock.
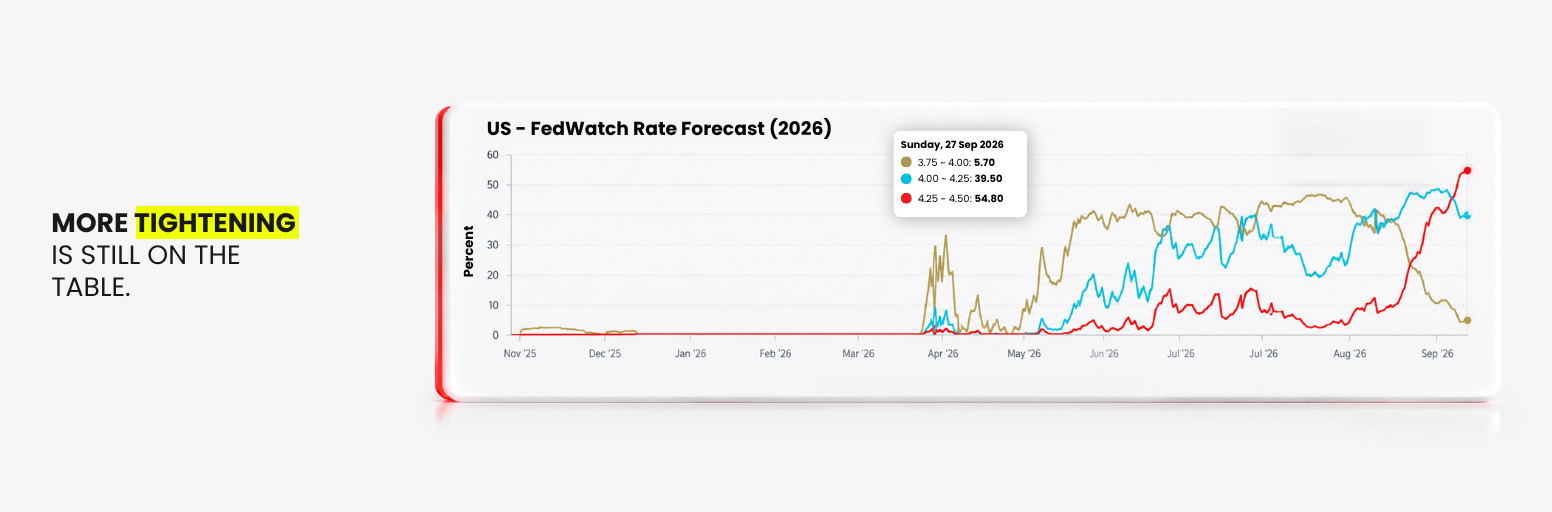
The data released since the September meeting has, if anything, reinforced that view. Hiring slowed sharply and the Fed’s preferred inflation gauge came in lighter than expected. Neither points to an economy that needs aggressive tightening from here.
The US Economy Enters Q4 With Mixed Signals
Earlier this year, the US growth picture looked much softer.
Real GDP expanded at annualized rates of 2.1% in Q1 and 1.5% in Q2.
We covered that deceleration, and why it did not amount to a recession signal, in US Q2 GDP Growth Slows, But Recession Fears Look Overdone.
The Q3 picture then changed materially, and changed again within two weeks.
Surveys Surged, Then Hiring Stalled
September’s flash S&P Global Composite PMI surged to 58.4, up from 56.0 in August, marking the fastest expansion in US business activity since July 2021. Employment growth in the survey also reached its strongest level in more than four years.
The catch?
Cost pressures accelerated too, reaching their highest in almost four years.
The hard data has not matched that strength. The Atlanta Fed’s GDPNow model estimated Q3 annualized real GDP growth at 5.0% on September 25. By October 1 that estimate had fallen to 3.7%.
The labour market told the same story. September payrolls rose by just 29,000, well below expectations, while the unemployment rate edged up to 4.2% from 4.1%.
That is a sharp reversal. A month earlier, payrolls beat expectations and the open question was whether inflation would catch up, which we set out in NFP Beats Expectations: Why Markets Are Still Waiting on CPI.
Survey strength and hiring weakness rarely sit together for long. One of the two is giving a false signal, and Q4 will show which.
Consumers Are Holding Up, Just
Consumers have remained more resilient than expected.
August retail and food-services sales rose 1.2% month over month and 6.0% year over year.
That does not mean households are under no pressure.
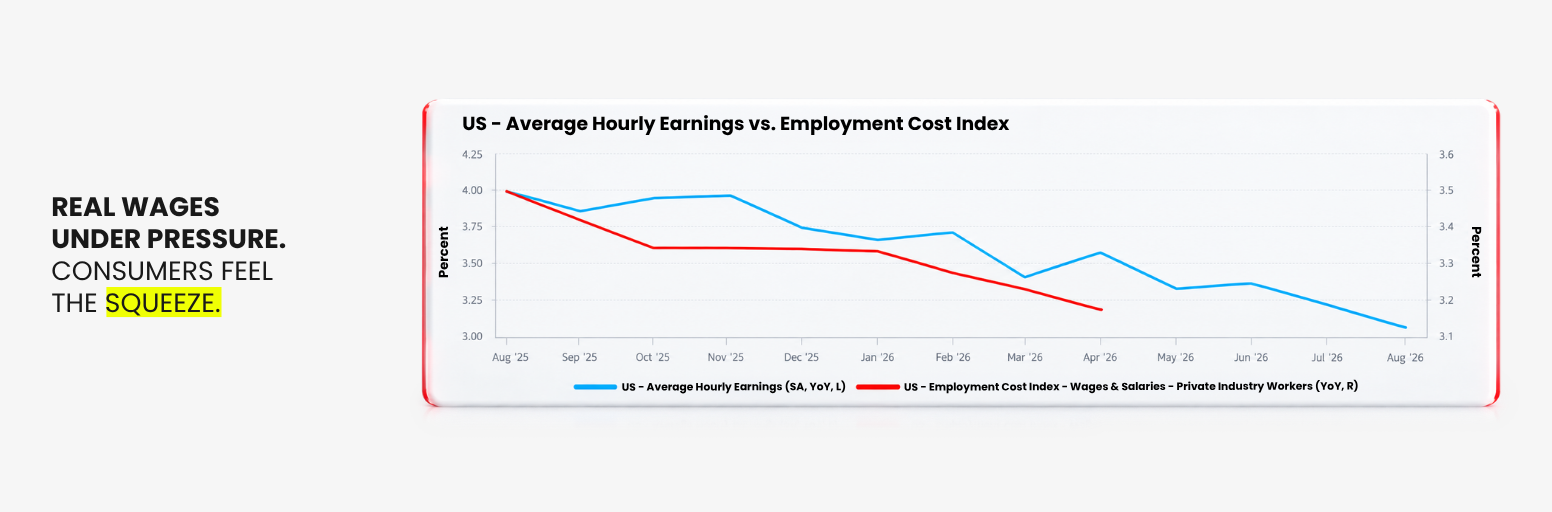
Real average hourly earnings fell 0.1% in August and were down 0.3% from a year earlier, showing that inflation is still eating into purchasing power. With hiring now slowing, the support underneath consumption looks thinner than it did a month ago.
A K-Shaped Expansion
So the US economy enters Q4 in an unusual position.
Growth is still positive, but it is decelerating, and the expansion remains uneven.
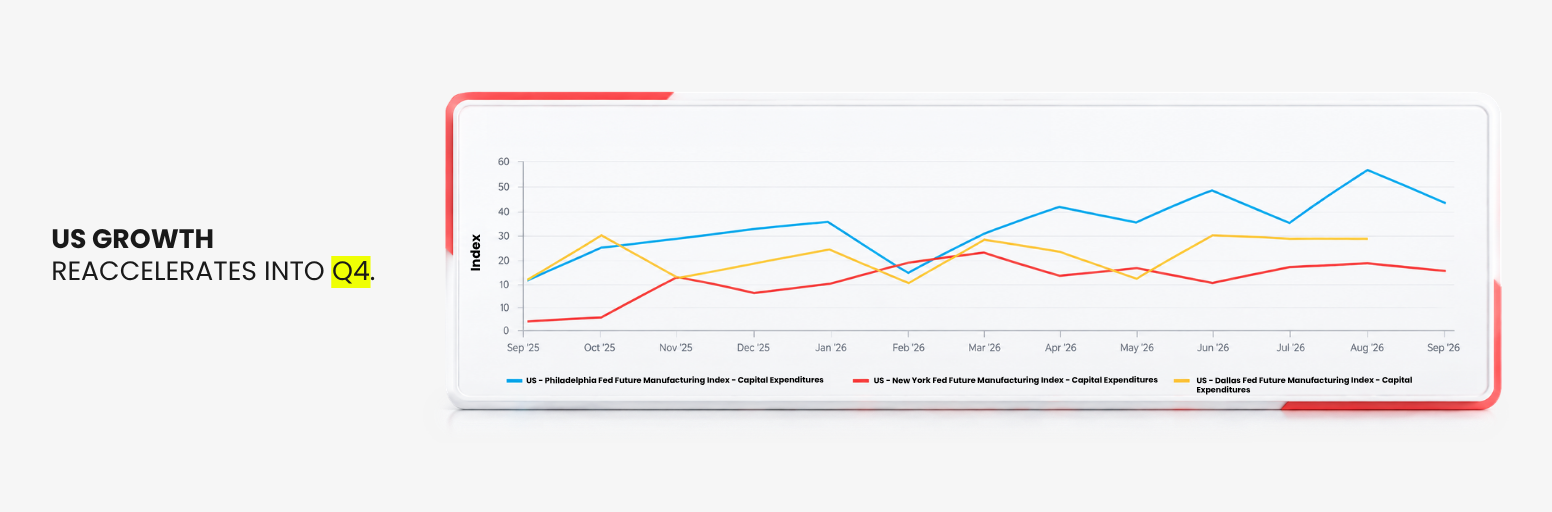
AI, technology investment and higher-income consumption are supporting activity, while elevated borrowing costs continue to weigh on more rate-sensitive parts of the economy.
This is not a classic slowdown.
It is closer to a K-shaped expansion, where strong investment and technology activity coexist with pressure elsewhere.
And that makes the Fed’s job harder.
Growth that holds up reduces the urgency to cut. A labour market that is cooling reduces the case for hiking much further. The Fed is being pulled in both directions at once.
That pull is not new. In August, after July’s payrolls fell outright against expectations of a gain, we set out the case for the Fed staying on hold in July Nonfarm Payrolls Miss: Why the Fed May Stay on Hold.
Q4 Inflation Is Still the Main Macro Risk
The biggest threat to the Q4 outlook remains inflation.
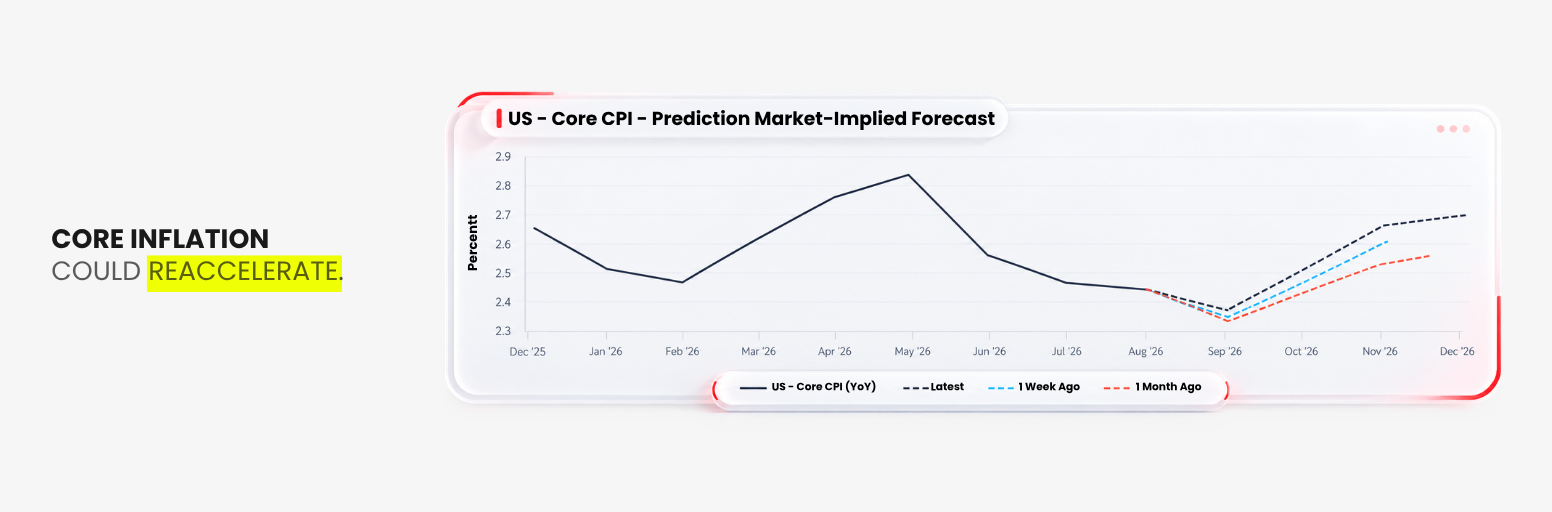
August headline CPI was 3.4% year over year, unchanged from July, while core CPI eased to 2.4%.
But monthly momentum was less comfortable.
Headline CPI rose 0.4% month over month, core CPI increased 0.3%, and energy prices jumped 2.1%.
That monthly pattern has run through the quarter. We covered August’s print, and why a CPI reading that met forecasts still produced a hike, in US CPI Meets Forecasts, So Why Did Fed Still Hike?, and July’s cooling in US July CPI Cools: Is Gold Better Positioned Than Tech?.
Oil Still Sets the Upper Bound
Oil remains the biggest external variable.
Brent spot crude was below USD90 at the end of August before surging to USD130.80 per barrel on September 15. It subsequently retreated sharply, illustrating just how volatile the energy shock remains.
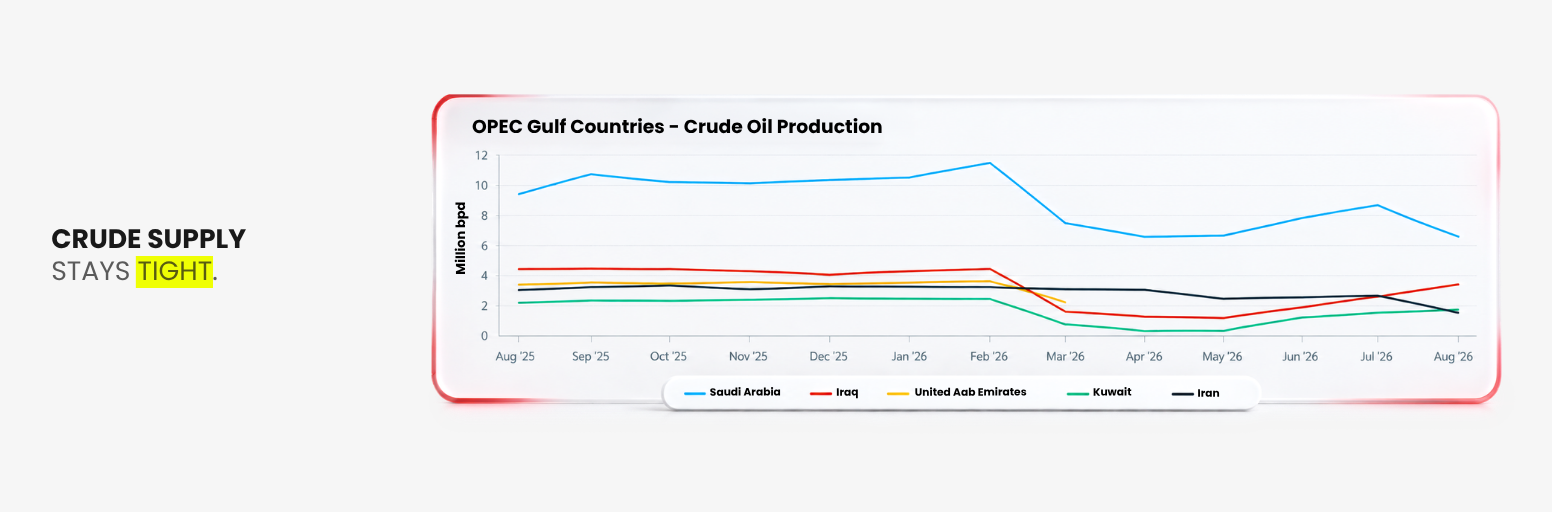
We set out that scenario in July, in Oil Blockade Risk: Could a Second Shock Push Crude Above $120?, when a second disruption looked capable of pushing crude past USD120. September’s peak went further than that.
That volatility matters because energy sets much of the upper bound for near-term inflation.
Housing and core services may determine where inflation settles in the middle, but another oil shock can quickly push headline inflation back up and eventually feed into transport, production and business costs.
D Prime’s baseline is that US headline CPI remains in roughly the low-to-mid 3% range during Q4, rather than returning quickly to the Fed’s 2% target.
That is a firmer baseline than the one we held at mid-year, when cooling June data suggested rate-hike fears were overpriced. We set out that view in US June CPI Cools: Why Rate Hike Fears May Still Be Overpriced.
The upside risk remains geopolitical. If energy prices surge again and second-round effects broaden, inflation could stay higher for longer and force the Fed into more tightening than markets currently expect.
The Fed’s Preferred Gauge Cooled
One recent reading cuts the other way.
August PCE, released by the BEA on September 30, held headline inflation at 3.4% while core eased to 3.0%, with core rising just 0.2% on the month, lighter than expected.
That matters because PCE, not CPI, is the measure the Fed targets. A softer core print makes the case for further tightening harder to argue, even with energy still unsettled.
Q4 therefore does not begin with stagflation as the base case. But the combination to watch is clearer than it was: cooling growth and cooling employment alongside inflation that will not return to target.
The Bond Market Is Tightening Faster Than the Fed
The bond market is already taking that possibility seriously.
On October 5, the official Treasury curve put the 10-year yield at 5.31% and the 30-year at 5.66%, both higher than a week earlier and well above where they started September.
That repricing has been running since late August, when the 10-year sat near 4.74% and Treasury buyback announcements failed to settle the market. We covered that episode in US Treasury Yields Spike: Why Buybacks May Not Stop the Bond Stress. The 10-year has added more than 55 basis points since.
That tells us something important:
The Fed is tightening, but the bond market is tightening even faster.
In September we mapped where the 10-year would sit under each path: roughly 4.6% to 4.9% with no further hikes, 4.8% to 5.2% with one, and 5.2% to 5.4% with two. At 5.31%, the market is already trading inside the two-hike band, well beyond what the Fed’s own projection implies.
For equities, housing and corporate financing, that may matter more than another isolated 25-basis-point policy move. We examined that dynamic in US Treasury Yields Stay High: Is a Debt Crisis Coming?
Europe and Japan Face the Same Uncomfortable Mix
The inflation problem is not uniquely American.
Europe: Better Growth, Worse Inflation
Eurozone annual inflation jumped to 3.8% in September, from 3.2% in August, its highest since 2023.
Energy inflation accelerated to 18.8%, up from 14.3%, while services inflation edged up to 3.2%.
At the same time, Europe’s growth picture has improved.
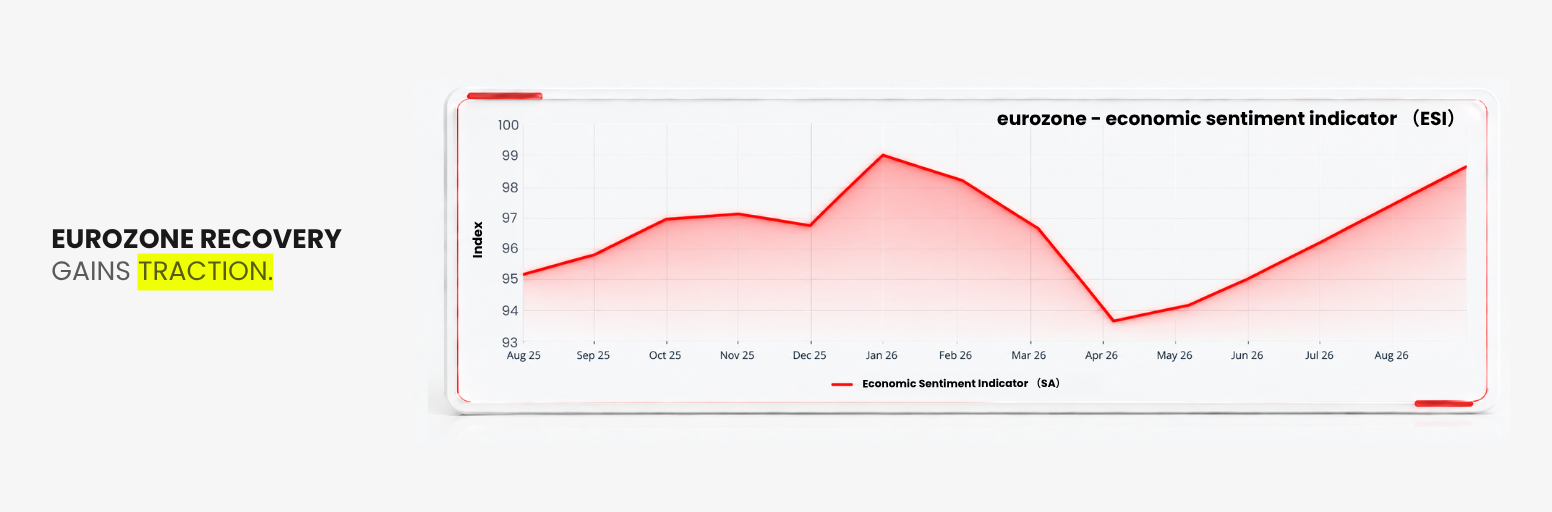
September’s flash Eurozone Composite PMI rose to 53.1, its strongest reading since April 2023.
Manufacturing has played a major role in that improvement, particularly in Germany, where activity has benefited from rising AI and defense spending.
Europe therefore faces the same uncomfortable combination as the US, in a sharper form:
better growth, but worse inflation.
Japan Is Normalizing, and Its Bond Market Is Repricing
Japan is different, but the direction is similar.
August headline CPI stood at 1.9%, while inflation excluding fresh food was 1.7%.
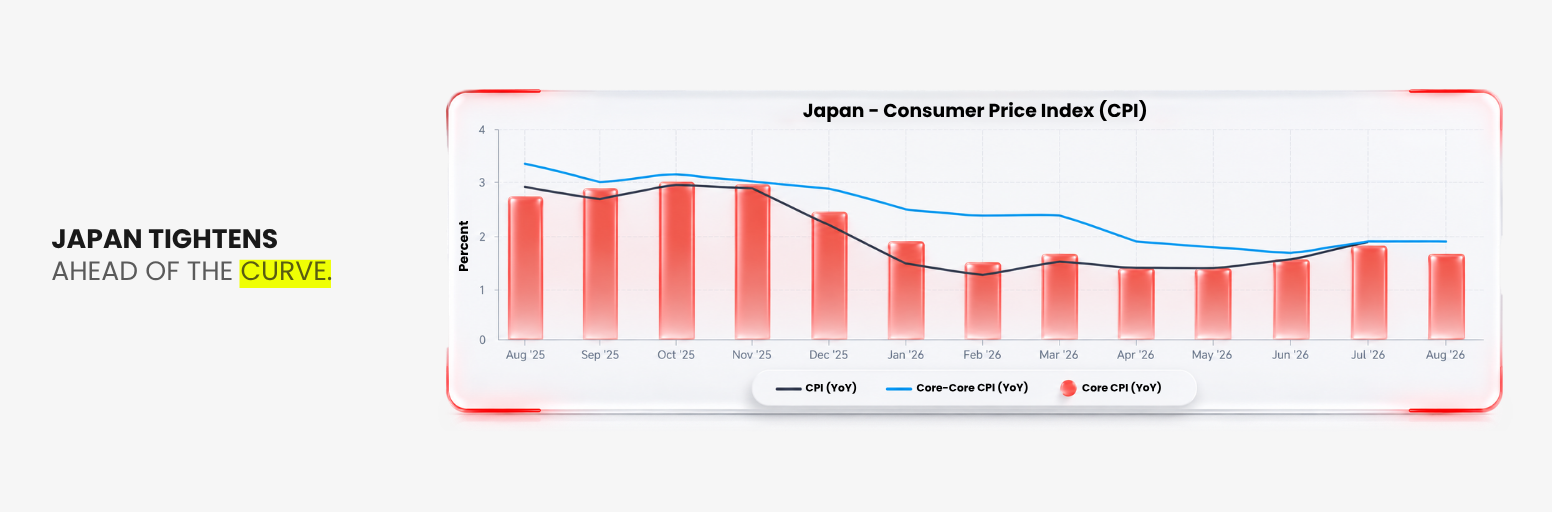
Those numbers are far lower than US or eurozone inflation.
Yet the BOJ has continued normalizing because growth, wages, imported costs and inflation expectations are all moving away from the ultra-low-inflation environment that defined Japan for decades.
Business conditions have improved too.
The BOJ’s September Tankan showed the large-manufacturer sentiment index at 24, up from 22 in June and improving for a sixth straight quarter.
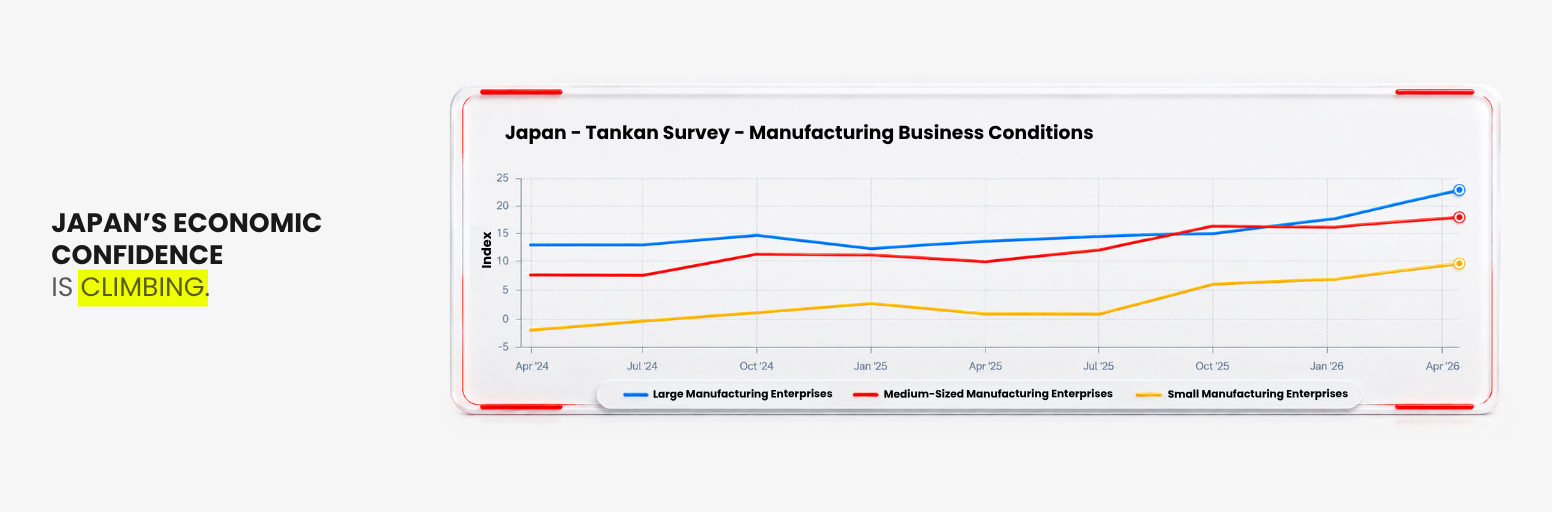
September’s flash PMI also showed Japan ending Q3 with one of its strongest quarters in years, with manufacturing supported by a surge in exports and a weak yen.
The other side of that normalization is the bond market.
Japan’s 10-year government bond yield has climbed to around 3.1%, its highest in roughly three decades.
That creates a new Q4 risk.
For decades, Japan provided the world with extraordinarily cheap funding.
As Japanese rates rise, some of that advantage disappears.
That can affect yen-funded carry trades, overseas bond demand and ultimately the global cost of capital.
The AI Wave Is Still Getting Stronger
Underneath the tighter macro environment, the AI cycle continues to accelerate.
And this may be the most important counterweight to Q4’s monetary headwinds.
Agents Reached Ordinary Users
Meta launched its Muse personal AI agent on September 8, moving agentic AI further from a technical concept toward a consumer product designed to handle real-world tasks such as sending emails and booking travel.
The adoption has been rapid.
Muse topped Apple’s US App Store and has surpassed 3.4 million downloads on Sensor Tower’s estimates. The app is currently US-only and estimates vary between firms, so the direction matters more than the exact figure.
OpenAI also released GPT-6 Astra in September, pushing further into computer use, coding, research and complex end-to-end work.
Compute Is Getting More Expensive Again
At the infrastructure level, the demand picture remains just as strong.
Nebius raised on-demand prices for several major GPU instances from October 1.
Its B300 price rose from USD7.85 to USD9.50 per GPU-hour, the B200 from USD7.15 to USD8.50, and the H200 from USD4.50 to USD5.40. Across its GPU range the increases run roughly 17% to 21%.
The broader manufacturing and trade data point in the same direction.
Global new export orders strengthened sharply in August, with S&P Global reporting some of the fastest export growth in almost five years, partly driven by demand for technology equipment, machinery, AI infrastructure and defense spending.
So the AI slowdown that markets feared earlier in the year has not become the dominant story.
If anything, the capacity cycle still looks tight.
The Policy Tension AI Creates
But this creates a policy tension.
AI is a source of growth, productivity expectations and corporate earnings.
It is also a major consumer of capital, electricity, chips, data-center capacity and financing.
That means the same AI boom supporting the economy may also contribute to a world where equilibrium interest rates and capital costs remain higher.
AI is therefore both the Q4 opportunity and part of the Q4 macro challenge.
What Should Traders Watch in Q4?
Two of the quarter’s early tests have already landed, and both pointed the same way.
August PCE (September 30): headline inflation held at 3.4% while core eased to 3.0%, lighter than expected.
September payrolls (October 2): hiring slowed to 29,000 and unemployment rose to 4.2%.
The calendar ahead:
September CPI (October 14): the first major test of whether August’s inflation pressure persisted into September, now that the labour market has softened.
FOMC (October 27 to 28), then December: the Fed’s two remaining meetings will test whether September was a one-off adjustment or the start of a longer tightening phase. The ECB also meets again in December.
Q3 earnings season: AI capital spending guidance is where the buildout either confirms itself or breaks.
Beyond the calendar, the most important market signals are the 10-year Treasury yield, oil, Japanese bond yields and AI earnings guidance.
Q4 is not simply a battle between rate hikes and growth.
It is a battle between two forces moving at the same time.
On one side: higher rates, persistent inflation and a more expensive global cost of capital.
On the other: an AI investment cycle that continues to drive productivity expectations, capital spending and earnings growth.
That is why D Prime’s Q4 theme is Tougher Macro Headwinds. Stronger AI Wave.
The macro backdrop is becoming harder. But the strongest technology cycle in years has not disappeared.
Which force wins will define the final quarter of 2026.
By D Prime Analysis Team
Macro and market strategy research by D Prime’s in-house analysis team.
Disclaimer
The information contained herein is provided for general informational and educational purposes only and does not constitute investment advice, financial advice, trading advice or any other form of professional advice, a recommendation, or an offer or solicitation to buy or sell any financial instruments or engage in any trading strategy.
Trading in leveraged products such as contracts for difference (CFDs) involves a significant risk of loss and may not be suitable for all investors. Past performance is not indicative of future results. Any references to market trends, asset performance, price levels, or forward-looking statements reflect opinions or general market commentary as at the date of publication and are subject to change without notice.
This article does not take into account any individual investor’s objectives, financial situation, or risk tolerance. Readers should conduct their own independent research and seek professional advice before making any investment or trading decisions. D Prime and its affiliates make no representations or warranties about the accuracy or completeness or reliability of this information and disclaim any and all liability for any direct, indirect, incidental, consequential, or other losses or damages arising out of or in connection with the use of or reliance on any information contained herein. The above information should not be used or considered as the basis for any trading decisions or as an invitation to engage in any transaction. Do not rely on this article to replace your independent judgment.
“D Prime” is a brand name of D Prime Vanuatu Limited, a company incorporated and regulated by the Vanuatu Financial Services Commission (Company Number: 700238). The availability of products and services may vary depending on jurisdiction and applicable regulatory requirements.