

1. Daily technical analysis of selected currency pairs
CAD/JPY Bearish
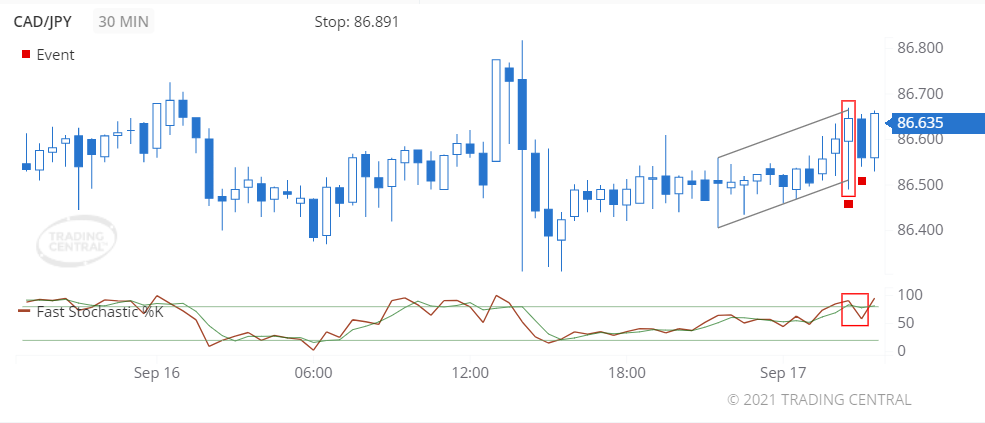
Image Features: forms “Hanging Man (Bearish)” pattern
Target
Opportunity recognized 2021 Sep 17 for the period of up to 12 hours
-0.011 (1.1 pips) price change since the Technical Event at 86.646
Technical Analysis
We found a pattern called Hanging Man on 2021 Sep 17 at 02:30 GMT on a 30 minute chart suggesting the outlook is bearish for up to 12 hours.
A bearish event triggered for Fast Stochastics on 2021 Sep 17 at 03:00 GMT when the %K line crossed below the %D line. The close prices are trading closer to the lower end of the recent high-low price range, which is associated with price decreases.
USD/AUD Bullish
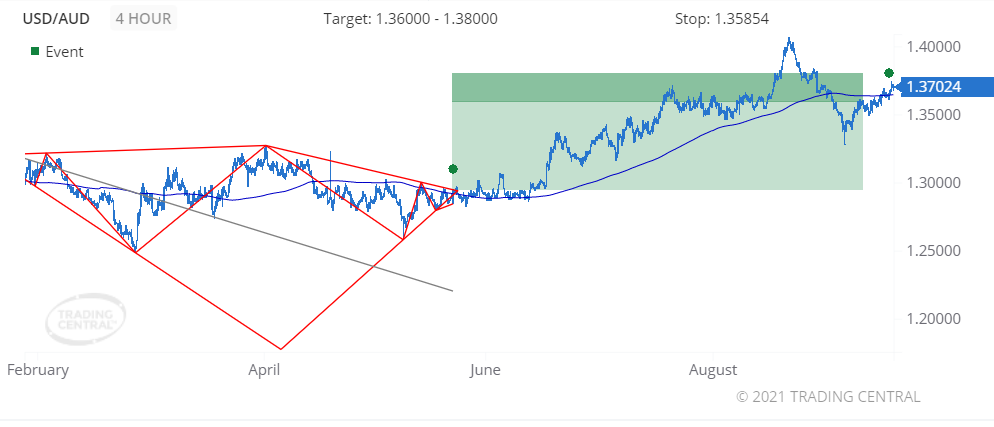
Image Features: forms “Diamond Bottom (Bullish)” pattern
Target
Opportunity recognized 2021 May 21 for the period of up to 2 weeks
+0.07516 (751.6 pips) price change since the Technical Event at 1.29508
Technical Analysis
We found a pattern called Diamond Bottom on 2021 May 21 at 17:00 GMT on a 4 hour chart, providing a target price for up to 2 weeks in the range of 1.36000 to 1.38000.
The price crossed above its moving average on 2021 Sep 16 at 05:00 GMT signaling a new uptrend has been established.
2. Daily Analyst’s View
EUR/USD
may fall 16 – 31 pips
Pivot
1.1785
Our preference
Short positions below 1.1785 with targets at 1.1750 & 1.1735 in extension.
Alternative scenario
Above 1.1785 look for further upside with 1.1800 & 1.1820 as targets.
Comment
As long as 1.1785 is resistance, look for choppy price action with a bearish bias.
GBP/USD
may fall 26 – 41 pips
Pivot
1.3820
Our preference
Short positions below 1.3820 with targets at 1.3765 & 1.3750 in extension.
Alternative scenario
Above 1.3820 look for further upside with 1.3840 & 1.3855 as targets.
Comment
As long as the resistance at 1.3820 is not surpassed, the risk of the break below 1.3765 remains high.
USD/CAD
may rise 32 – 52 pips
Pivot
1.2650
Our preference
Long positions above 1.2650 with targets at 1.2710 & 1.2730 in extension.
Alternative scenario
Below 1.2650 look for further downside with 1.2630 & 1.2610 as targets.
Comment
The RSI is above its neutrality area at 50%.
Gold
may fall to 1735.00 – 1745.00
Pivot
1764.00
Our preference
Short positions below 1764.00 with targets at 1745.00 & 1735.00 in extension.
Alternative scenario
Above 1764.00 look for further upside with 1775.00 & 1784.00 as targets.
Comment
Intraday technical indicators are mixed.
Crude Oil (WTI)
may rise to 73.00 – 73.50
Pivot
72.15
Our preference
Long positions above 72.15 with targets at 73.00 & 73.50 in extension.
Alternative scenario
Below 72.15 look for further downside with 71.55 & 71.00 as targets.
Comment
The RSI is mixed with a bullish bias.
S&P 500 (CME)
may rise to 4482.00 – 4495.00
Pivot
4452.00
Our preference
Long positions above 4452.00 with targets at 4482.00 & 4495.00 in extension.
Alternative scenario
Below 4452.00 look for further downside with 4443.00 & 4425.00 as targets.
Comment
The RSI is mixed and calls for caution.
Nasdaq 100 (CME)
may rise to 15555.00 – 15600.00
Pivot
15450.00
Our preference
Long positions above 15450.00 with targets at 15555.00 & 15600.00 in extension.
Alternative scenario
Below 15450.00 look for further downside with 15415.00 & 15360.00 as targets.
Comment
The RSI is mixed with a bullish bias.
Hang Seng (HKFE)
may fall to 24330.00 – 24480.00
Pivot
24930.00
Our preference
Short positions below 24930.00 with targets at 24480.00 & 24330.00 in extension.
Alternative scenario
Above 24930.00 look for further upside with 25270.00 & 25480.00 as targets.
Comment
As long as the resistance at 24930.00 is not surpassed, the risk of the break below 24480.00 remains high.
Disclaimer:
This report is prepared and published by Trading Central for all clients of Doo Prime. As a third-party indicator tool, Trading Central is only for your strategic reference during the investment process and does not constitute advice or a recommendation by Doo Prime or Trading Central. Neither Doo Prime nor Trading Central are responsible to bear the relevant legal liabilities for the investment risks arising from your use of this report to make buying and selling decisions.