

1. Daily technical analysis of selected currency pairs
AUD/CAD Bearish
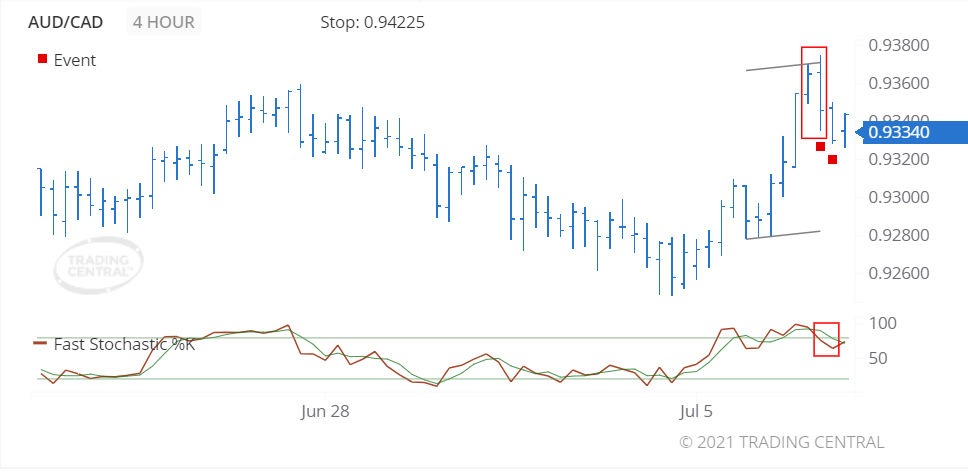
Image Features: forms “Outside Bar (Bearish)” pattern
Target
Opportunity recognized 2021 Jul 06 for the period of up to 48 hours
-0.00117 (11.7 pips) price change since the Technical Event at 0.93457
Technical Analysis
We found a pattern called Outside Bar (Bearish) on 2021 Jul 06 at 17:00 GMT on a 4 hour chart suggesting the outlook is bearish for up to 48 hours.
A bearish event triggered for Fast Stochastics on 2021 Jul 06 at 21:00 GMT when the %K line crossed below the %D line. The close prices are trading closer to the lower end of the recent high-low price range, which is associated with price decreases.
EUR/JPY Bullish
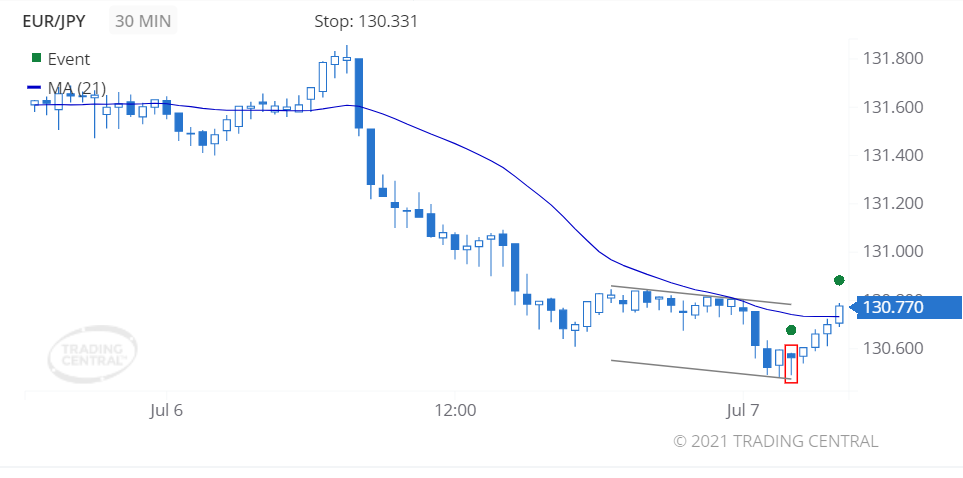
Image Features: forms “Hammer (Bullish)” pattern
Target
Opportunity recognized 2021 Jul 07 for the period of up to 12 hours
+0.207 (20.7 pips) price change since the Technical Event at 130.563
Technical Analysis
We found a pattern called Hammer on 2021 Jul 07 at 02:00 GMT on a 30 minute chart suggesting the outlook is bullish for up to 12 hours.
The price crossed above its moving average on 2021 Jul 07 at 04:00 GMT signaling a new uptrend has been established.
2. Daily Analyst’s View
EUR/USD
may fall 17 – 32 pips
Pivot
1.1840
Our preference
Short positions below 1.1840 with targets at 1.1805 & 1.1790 in extension.
Alternative scenario
Above 1.1840 look for further upside with 1.1860 & 1.1875 as targets.
Comment
As long as the resistance at 1.1840 is not surpassed, the risk of the break below 1.1805 remains high.
GBP/USD
may fall 25 – 45 pips
Pivot
1.3820
Our preference
Short positions below 1.3820 with targets at 1.3770 & 1.3750 in extension.
Alternative scenario
Above 1.3820 look for further upside with 1.3845 & 1.3870 as targets.
Comment
Technically the RSI is below its neutrality area at 50.
USD/CAD
may rise 26 – 51 pips
Pivot
1.2445
Our preference
Long positions above 1.2445 with targets at 1.2495 & 1.2520 in extension.
Alternative scenario
Below 1.2445 look for further downside with 1.2420 & 1.2395 as targets.
Comment
The RSI lacks downward momentum.
Gold
may fall to 1783.00 – 1789.00
Pivot
1805.00
Our preference
Short positions below 1805.00 with targets at 1789.00 & 1783.00 in extension.
Alternative scenario
Above 1805.00 look for further upside with 1815.00 & 1825.00 as targets.
Comment
As long as 1805.00 is resistance, expect a return to 1789.00.
Crude Oil (WTI)
may fall to 72.00 – 72.90
Pivot
74.20
Our preference
Short positions below 74.20 with targets at 72.90 & 72.00 in extension.
Alternative scenario
Above 74.20 look for further upside with 74.95 & 76.00 as targets.
Comment
The RSI shows downside momentum.
S&P 500 (CME)
may rise to 4348.00 – 4360.00
Pivot
4320.00
Our preference
Long positions above 4320.00 with targets at 4348.00 & 4360.00 in extension.
Alternative scenario
Below 4320.00 look for further downside with 4306.00 & 4294.00 as targets.
Comment
The RSI is mixed to bullish.
Nasdaq 100 (CME)
may rise to 14840.00 – 14900.00
Pivot
14715.00
Our preference
Long positions above 14715.00 with targets at 14840.00 & 14900.00 in extension.
Alternative scenario
Below 14715.00 look for further downside with 14625.00 & 14555.00 as targets.
Comment
The RSI is mixed with a bullish bias.
Hang Seng (HKFE)
may fall to 27500.00 – 27650.00
Pivot
27940.00
Our preference
Short positions below 27940.00 with targets at 27650.00 & 27500.00 in extension.
Alternative scenario
Above 27940.00 look for further upside with 28110.00 & 28250.00 as targets.
Comment
Intraday technical indicators are mixed and call for caution.
Disclaimer:
This report is prepared and published by Trading Central for all clients of Doo Prime. As a third-party indicator tool, Trading Central is only for your strategic reference during the investment process and does not constitute advice or a recommendation by Doo Prime or Trading Central. Neither Doo Prime nor Trading Central are responsible to bear the relevant legal liabilities for the investment risks arising from your use of this report to make buying and selling decisions.