

1. Daily technical analysis of selected currency pairs
CAD/JPY Bullish
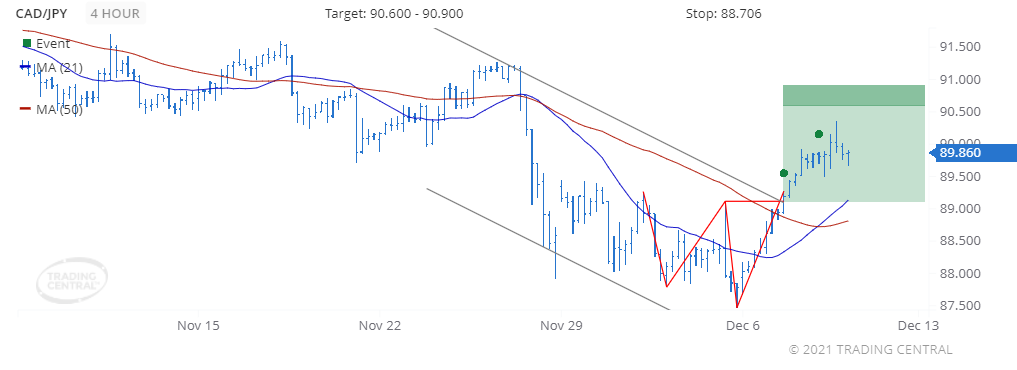
Image Features: forms “Double Bottom (Bullish)” pattern
Target
Opportunity recognized 2021 Dec 07 for the period of up to 2 weeks
+0.744 (74.4 pips) price change since the Technical Event at 89.116
Technical Analysis
We found a pattern called Double Bottom on 2021 Dec 07 at 05:00 GMT on a 4 hour chart, providing a target price for up to 2 weeks in the range of 90.600 to 90.900.
The faster moving average crossed above the slower moving average on 2021 Dec 08 at 05:00 GMT, signaling a new uptrend has been established.
EUR/JPY Bullish
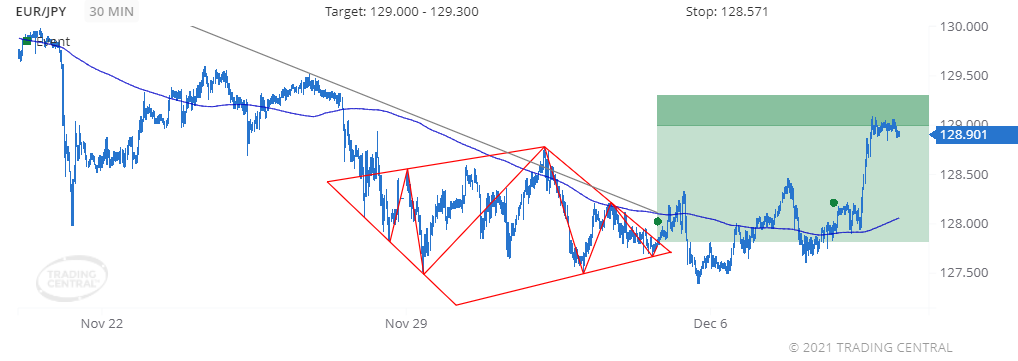
Image Features: forms “Diamond Bottom (Bullish)” pattern
Target
Opportunity recognized 2021 Dec 03 for the period of up to 2 weeks
+1.078 (107.8 pips) price change since the Technical Event at 127.823
Technical Analysis
We found a pattern called Diamond Bottom on 2021 Dec 03 at 04:00 GMT on a 30 minute chart, providing a target price for up to 2 weeks in the range of 129.000 to 129.300.
The price crossed above its moving average on 2021 Dec 08 at 01:00 GMT signaling a new uptrend has been established.
2. Daily Analyst’s View
EUR/USD
may rise 24 – 49 pips
Pivot
1.1300
Our preference
Long positions above 1.1300 with targets at 1.1365 & 1.1390 in extension.
Alternative scenario
Below 1.1300 look for further downside with 1.1275 & 1.1255 as targets.
Comment
The break above 1.1300 is a positive signal that has opened a path to 1.1365.
GBP/USD
may fall 22 – 42 pips
Pivot
1.3235
Our preference
Short positions below 1.3235 with targets at 1.3180 & 1.3160 in extension.
Alternative scenario
Above 1.3235 look for further upside with 1.3260 & 1.3285 as targets.
Comment
As long as the resistance at 1.3235 is not surpassed, the risk of the break below 1.3180 remains high.
USD/CAD
may rise 17 – 52 pips
Pivot
1.2610
Our preference
Long positions above 1.2610 with targets at 1.2670 & 1.2705 in extension.
Alternative scenario
Below 1.2610 look for further downside with 1.2580 & 1.2550 as targets.
Comment
The RSI calls for a rebound.
Gold
may fall to 1772.00 – 1779.00
Pivot
1789.00
Our preference
Short positions below 1789.00 with targets at 1779.00 & 1772.00 in extension.
Alternative scenario
Above 1789.00 look for further upside with 1793.00 & 1798.00 as targets.
Comment
The RSI is mixed with a bearish bias.
Crude Oil (WTI)
may rise to 75.90 – 79.25
Pivot
66.20
Our preference
Long positions above 66.20 with targets at 75.90 & 79.25 in extension.
Alternative scenario
Below 66.20 look for further downside with 63.10 & 61.00 as targets.
Comment
The RSI calls for a rebound.
S&P 500 (CME)
may rise to 4726.00 – 4747.00
Pivot
4659.00
Our preference
Long positions above 4659.00 with targets at 4726.00 & 4747.00 in extension.
Alternative scenario
Below 4659.00 look for further downside with 4635.00 & 4608.00 as targets.
Comment
The RSI is bullish and calls for further advance.
Nasdaq 100 (CME)
may rise to 16570.00 – 16700.00
Pivot
16240.00
Our preference
Long positions above 16240.00 with targets at 16570.00 & 16700.00 in extension.
Alternative scenario
Below 16240.00 look for further downside with 16100.00 & 15990.00 as targets.
Comment
The RSI is bullish and calls for further advance.
Hang Seng (HKFE)
may rise to 24450.00 – 24660.00
Pivot
23910.00
Our preference
Long positions above 23910.00 with targets at 24450.00 & 24660.00 in extension.
Alternative scenario
Below 23910.00 look for further downside with 23695.00 & 23500.00 as targets.
Comment
The RSI calls for a new upleg.
Disclaimer:
This report is prepared and published by Trading Central for all clients of Doo Prime. As a third-party indicator tool, Trading Central is only for your strategic reference during the investment process and does not constitute advice or a recommendation by Doo Prime or Trading Central. Neither Doo Prime nor Trading Central are responsible to bear the relevant legal liabilities for the investment risks arising from your use of this report to make buying and selling decisions.