

1. Daily technical analysis of selected currency pairs
CAD/JPY Bullish
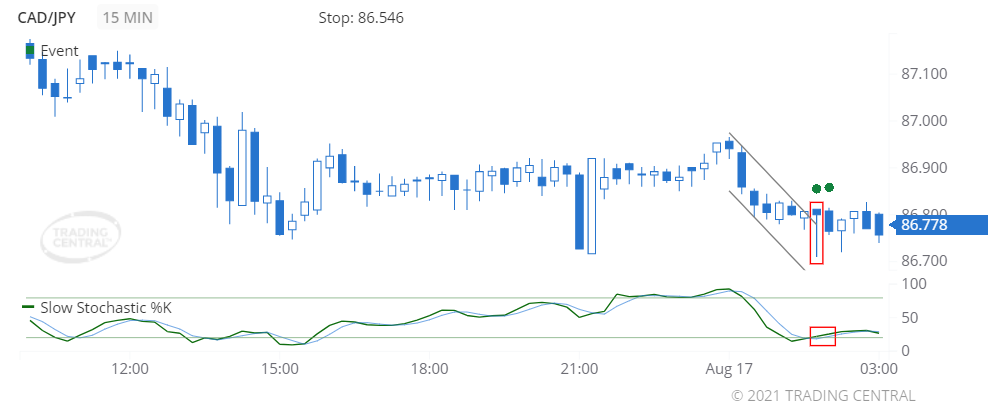
Image Features: forms “Hammer (Bullish)” pattern
Target
Opportunity recognized 2021 Aug 17 for the period of up to 12 hours
-0.022 (2.2 pips) price change since the Technical Event at 86.800
Technical Analysis
We found a pattern called Hammer on 2021 Aug 17 at 01:45 GMT on a 15 minute chart suggesting the outlook is bullish for up to 12 hours.
A bullish event triggered for Slow Stochastics on 2021 Aug 17 at 02:00 GMT when the %K line crossed above the %D line. The close prices are trading closer to the upper end of the recent high-low price range, which is associated with price increases.
USD/AUD Bearish
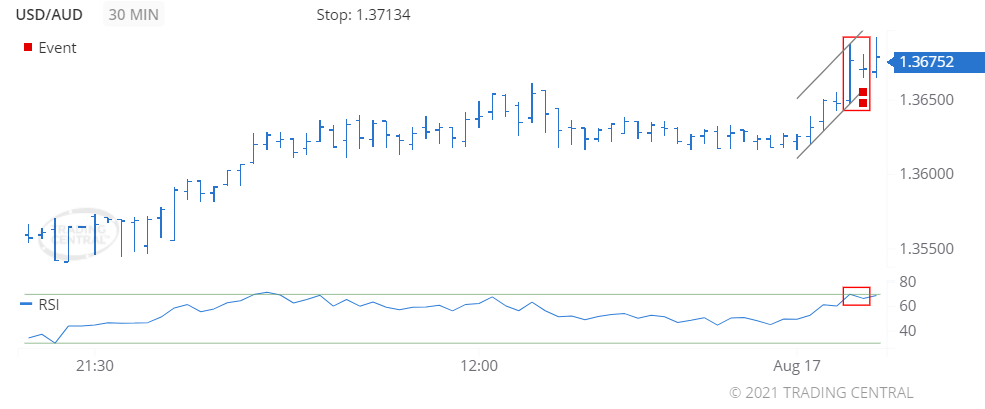
Image Features: forms “Inside Bar (Bearish)” pattern
Target
Opportunity recognized 2021 Aug 17 for the period of up to 12 hours
+0.00043 (4.3 pips) price change since the Technical Event at 1.36709
Technical Analysis
We found a pattern called Inside Bar (Bearish) on 2021 Aug 17 at 02:30 GMT on a 30 minute chart suggesting the outlook is bearish for up to 12 hours.
The RSI fallen below 70 on 2021 Aug 17 at 02:30 GMT, telling us the price is starting to pull back from being overbought.
2. Daily Analyst’s View
EUR/USD
may fall 13 – 28 pips
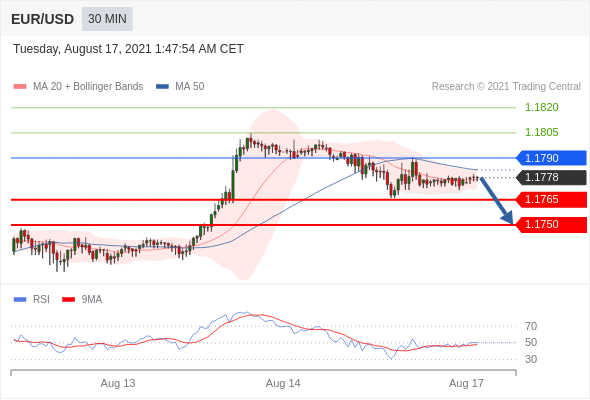
Pivot
1.1790
Our preference
Short positions below 1.1790 with targets at 1.1765 & 1.1750 in extension.
Alternative scenario
Above 1.1790 look for further upside with 1.1805 & 1.1820 as targets.
Comment
As long as the resistance at 1.1790 is not surpassed, the risk of the break below 1.1765 remains high.
GBP/USD
may fall 17 – 32 pips
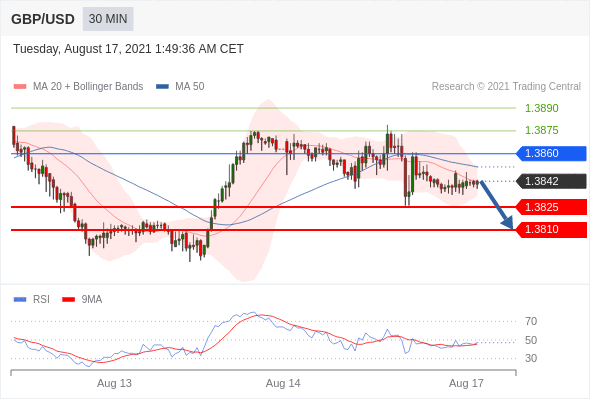
Pivot
1.3860
Our preference
Short positions below 1.3860 with targets at 1.3825 & 1.3810 in extension.
Alternative scenario
Above 1.3860 look for further upside with 1.3875 & 1.3890 as targets.
Comment
The RSI calls for a drop.
USD/CAD
may rise 21 – 41 pips
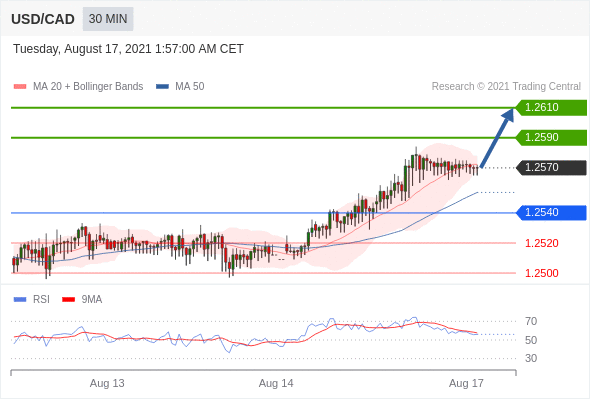
Pivot
1.2540
Our preference
Long positions above 1.2540 with targets at 1.2590 & 1.2610 in extension.
Alternative scenario
Below 1.2540 look for further downside with 1.2520 & 1.2500 as targets.
Comment
The RSI advocates for further advance.
Gold
may rise to 1800.00 – 1808.00
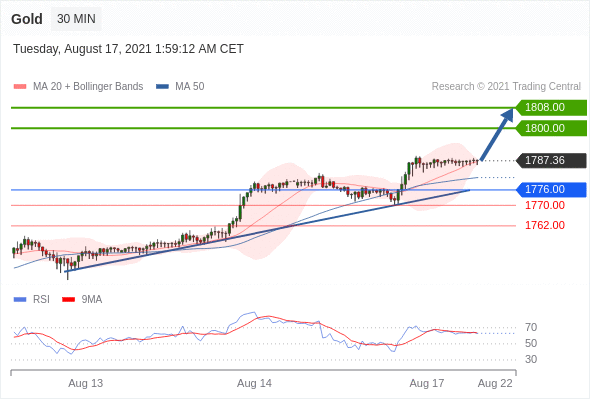
Pivot
1776.00
Our preference
Long positions above 1776.00 with targets at 1800.00 & 1808.00 in extension.
Alternative scenario
Below 1776.00 look for further downside with 1770.00 & 1762.00 as targets.
Comment
The RSI is mixed with a bullish bias.
Crude Oil (WTI)
may rise to 68.10 – 68.55
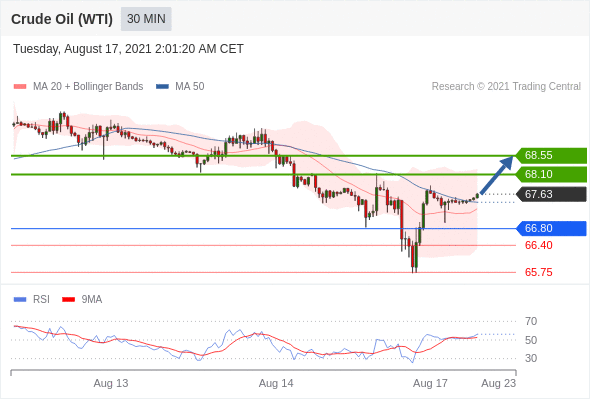
Pivot
66.80
Our preference
Long positions above 66.80 with targets at 68.10 & 68.55 in extension.
Alternative scenario
Below 66.80 look for further downside with 66.40 & 65.75 as targets.
Comment
The next resistances are at 68.10 and then at 68.55.
S&P 500 (CME)
may rise to 4480.00 – 4490.00
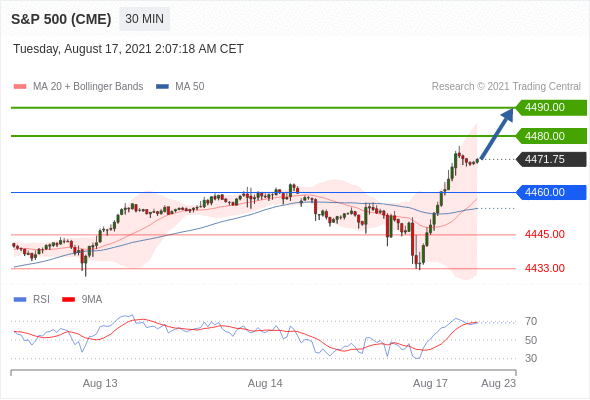
Pivot
4460.00
Our preference
Long positions above 4460.00 with targets at 4480.00 & 4490.00 in extension.
Alternative scenario
Below 4460.00 look for further downside with 4445.00 & 4433.00 as targets.
Comment
The RSI is bullish and calls for further advance.
Nasdaq 100 (CME)
may rise to 15175.00 – 15245.00
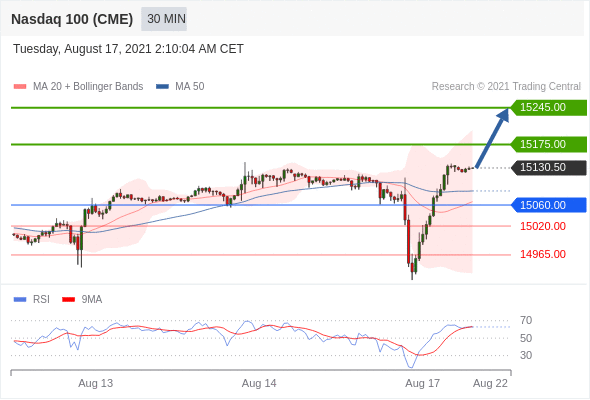
Pivot
15060.00
Our preference
Long positions above 15060.00 with targets at 15175.00 & 15245.00 in extension.
Alternative scenario
Below 15060.00 look for further downside with 15020.00 & 14965.00 as targets.
Comment
The RSI calls for a new upleg.
Hang Seng (HKFE)
may fall to 25815.00 – 25900.00
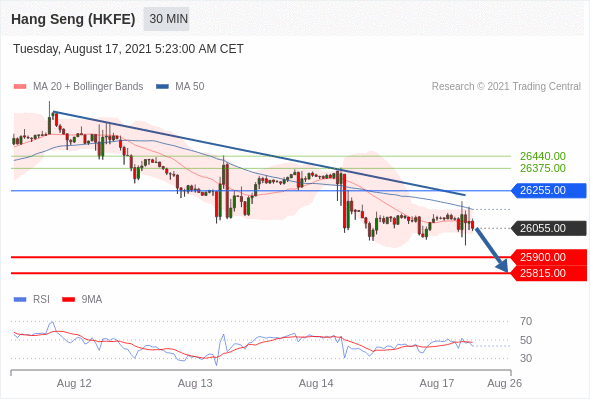
Pivot
26255.00
Our preference
Short positions below 26255.00 with targets at 25900.00 & 25815.00 in extension.
Alternative scenario
Above 26255.00 look for further upside with 26375.00 & 26440.00 as targets.
Comment
The immediate trend remains down but the momentum is weak.
Disclaimer:
This report is prepared and published by Trading Central for all clients of Doo Prime. As a third-party indicator tool, Trading Central is only for your strategic reference during the investment process and does not constitute advice or a recommendation by Doo Prime or Trading Central. Neither Doo Prime nor Trading Central are responsible to bear the relevant legal liabilities for the investment risks arising from your use of this report to make buying and selling decisions.