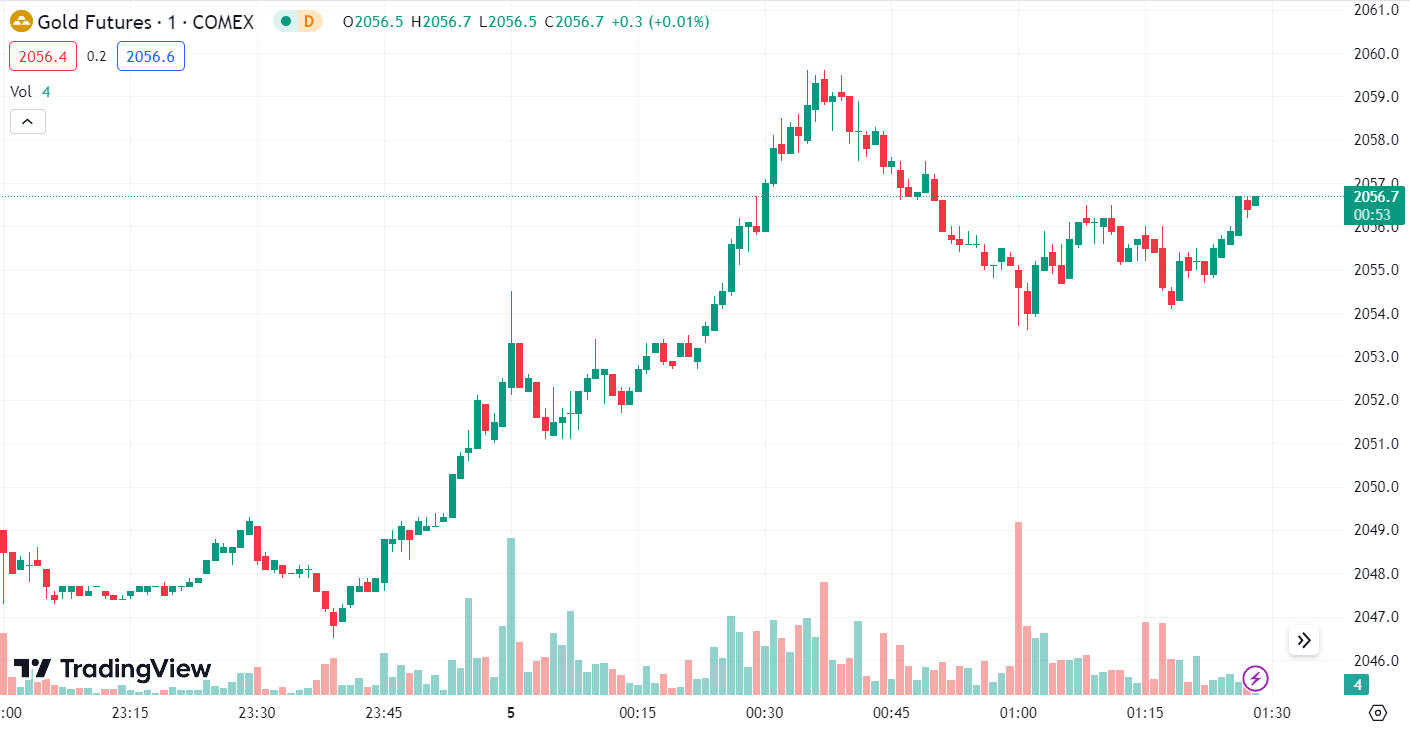
Due to a pullback in U.S. stocks and bonds, gold briefly hit an all-time high during the trading session but later experienced a sharp decline, retracing from the record peak and marking the largest single-day drop in 10 months.
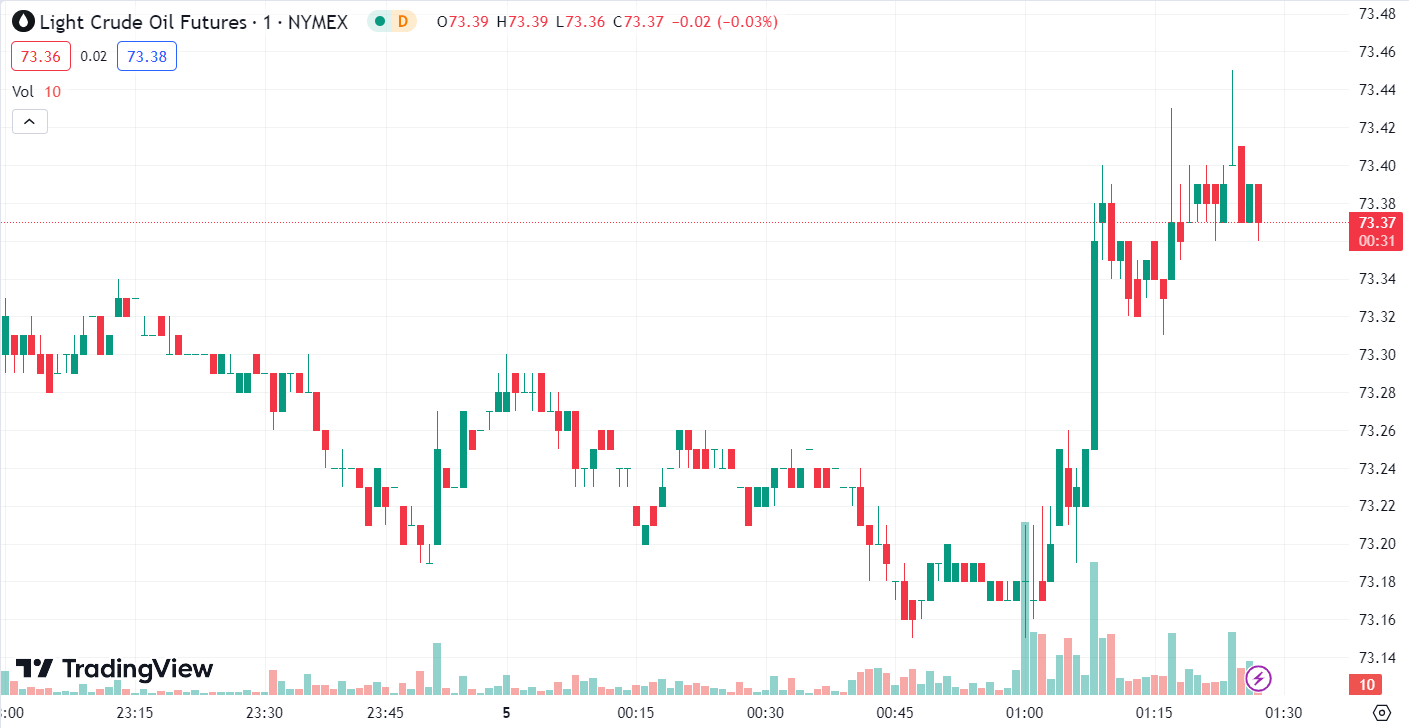
Traders adopted a wait-and-see approach to OPEC and its allies’ production cuts planned for the first quarter of 2024. Additionally, pressure intensified due to a decline in demand, leading to a more than 1% drop in oil prices.
Gold >>
On Monday, spot gold experienced significant volatility, with a fluctuation nearing 6%, marking its largest swing since September 2020. It closed at $2029.05 per ounce, down 2.07%, marking its poorest single-day performance since February. Gold futures also fell by 2.27%, closing at $2042.20 per ounce.
The market widely anticipates the possibility of the Federal Reserve implementing an interest rate cut policy in the first half of next year.
If interest rates decrease, it could weaken the position of the U.S. dollar, making gold priced in dollars more attractive to international buyers, thereby increasing demand. Additionally, escalating geopolitical conflicts in the Middle East over the past two months have supported the rise in gold prices.
The pullback in gold’s surge is primarily influenced by technical factors, as the price reached strong overbought levels, prompting some investors to take profits.
However, the fundamentals continue to favor gold, with weak inflation and soft macroeconomic data in the United States being the main supporting factors.
Gold’s technical aspect witnessed significant fluctuations, experiencing rapid turns in both directions during the day. In the early Asian session, it quickly surged, breaking through the $2080 mark and accelerating above $2100. It reached around $2144, facing resistance before retracting.
In the afternoon, it continued to oscillate downward, breaking below key levels and weakening further. In the late U.S. session, weak attempts at a rebound were resisted around the $2070 mark, leading to another decline, breaking through the $2020 mark and closing weakly.
Technical Analysis:

Today’s short-term strategy for gold suggests prioritizing short positions during rebounds, with long positions considered as a secondary approach during pullbacks.
- Key resistance levels to watch in the short term are around 2040-2050.
- Key support levels to watch in the short term are around 2010-2000.
WTI Crude Oil >>
On Monday, WTI crude oil futures dropped by 1.39%, closing at $73.04 per barrel, while Brent crude oil futures declined by $0.85 per barrel, or 1.08%, closing at $78.03 per barrel.
The decline in oil prices is attributed to traders adopting a cautious stance towards OPEC and its allies’ production cut plans for the first quarter of 2024, coupled with decreasing demand.
The disappointment set in as the meeting results revealed that OPEC+ member countries individually declared “voluntary” production cuts for the first quarter of the next year, totaling 2.193 million barrels per day, falling short of expectations.
Investors shifted their focus to the unfavorable aspects of the production cuts, leading to a sharp short-term decline in oil prices.
Technically, oil prices continued to experience a downward adjustment under narrow range oscillations, with bearish pressure persisting. During the European session, there was a slight rebound, but it faced resistance around $74.1 per barrel, quickly retracing below.
The overall trend did not show accelerated weakness but rather involved repetitive fluctuations around the $72.6 mark. In the late-night and early-morning sessions, there was a second attempt to rebound, breaking through the $74.8 level, yet facing resistance and closing weakly.
Technical Analysis:

Today’s crude oil trading strategy suggests prioritizing short positions during rebounds, with long positions considered as a secondary approach during pullbacks.
- Key resistance levels to monitor in the short term are around 75.0-76.0.
- Key support levels to monitor in the short term are around 72.0-71.0.
Forward-looking Statements
This article contains “forward-looking statements” and may be identified by the use of forward-looking terminology such as “anticipate”, “believe”, “continue”, “could”, “estimate”, “expect”, “hope”, “intend”, “may”, “might”, “plan”, “potential”, “predict”, “should”, or “will”, or other variations thereon or comparable terminology. However, the absence of such terminology does not mean that a statement is not forward-looking. In particular, statements about the expectations, beliefs, plans, objectives, assumptions, future events, or future performance of Doo Prime will be generally assumed as forward-looking statements.
Doo Prime has provided these forward-looking statements based on all current information available to Doo Prime and Doo Prime’s current expectations, assumptions, estimates, and projections. While Doo Prime believes these expectations, assumptions, estimations, and projections are reasonable, these forward-looking statements are only predictions and involve known and unknown risks and uncertainties, many of which are beyond Doo Prime’s control. Such risks and uncertainties may cause results, performance, or achievements materially different from those expressed or implied by the forward-looking statements.
Doo Prime does not provide any representation or warranty on the reliability, accuracy, or completeness of such statements. Doo Prime is not obliged to provide or release any updates or revisions to any forward-looking statements.
Disclaimer
While every effort has been made to ensure the accuracy of the information in this document, DOO Prime does not warrant or guarantee the accuracy, completeness or reliability of this information. DOO Prime does not accept responsibility for any losses or damages arising directly or indirectly, from the use of this document. The material contained in this document is provided solely for general information and educational purposes and is not and should not be construed as, an offer to buy or sell, or as a solicitation of an offer to buy or sell, securities, futures, options, bonds or any other relevant financial instruments or investments. Nothing in this document should be taken as making any recommendations or providing any investment or other advice with respect to the purchase, sale or other disposition of financial instruments, any related products or any other products, securities or investments. Trading involves risk and you are advised to exercise caution in relation to the report. Before making any investment decision, prospective investors should seek advice from their own financial advisers, take into account their individual financial needs and circumstances and carefully consider the risks associated with such investment decision.


