

Market Overview
On Thursday, gold prices retreated from record highs as the US dollar rebounded ahead of the nonfarm payrolls (NFP) report, and some investors took profits. Gold briefly dropped to $2,834.08 per ounce before recovering to close at $2,856.05 per ounce.
Meanwhile, oil prices extended losses after President Trump reaffirmed his commitment to increasing US oil production, raising concerns about oversupply. WTI crude futures settled down 0.6%.
Gold Overview
Gold prices pulled back on Thursday as the US dollar strengthened ahead of the highly anticipated US jobs report, prompting profit-taking. Gold hit an intraday low of $2,834.08 before recovering to close 0.39% lower at $2,856.05 per ounce.
Gold Market Drivers
- US Dollar & Bond Yields:
- The US dollar index initially rose 0.4% to 108.10 but trimmed gains after jobless claims data, ending at 107.70.
- US Treasury yields edged higher, slightly pressuring gold.
- Key Economic Data in Focus:
- The January nonfarm payrolls (NFP) report, the first under Trump’s new term, is expected to show 170,000 job gains, down from 256,000 in December.
- Unemployment rate forecast: 4.1%.
- Factors such as Trump’s new policies and recent wildfires may influence the final report.
- Goldman Sachs Forecast:
- Gold could reach $3,000 per ounce by Q2 2026, driven by:
- Fed rate cut expectations.
- Central bank gold purchases.
- Steady inflows into gold ETFs.
- However, Goldman cautions that if tariff uncertainties ease and market positioning normalizes, gold could see a short-term correction.
- Gold could reach $3,000 per ounce by Q2 2026, driven by:
Technical Analysis – Gold
Gold faced resistance at $2,870, triggering a pullback:
- US session: Gold dipped below $2,850, hitting $2,834 before bouncing back.
- Daily Chart: A bearish candle formed, signaling consolidation below $2,870 after struggling at $2,880 the previous day.
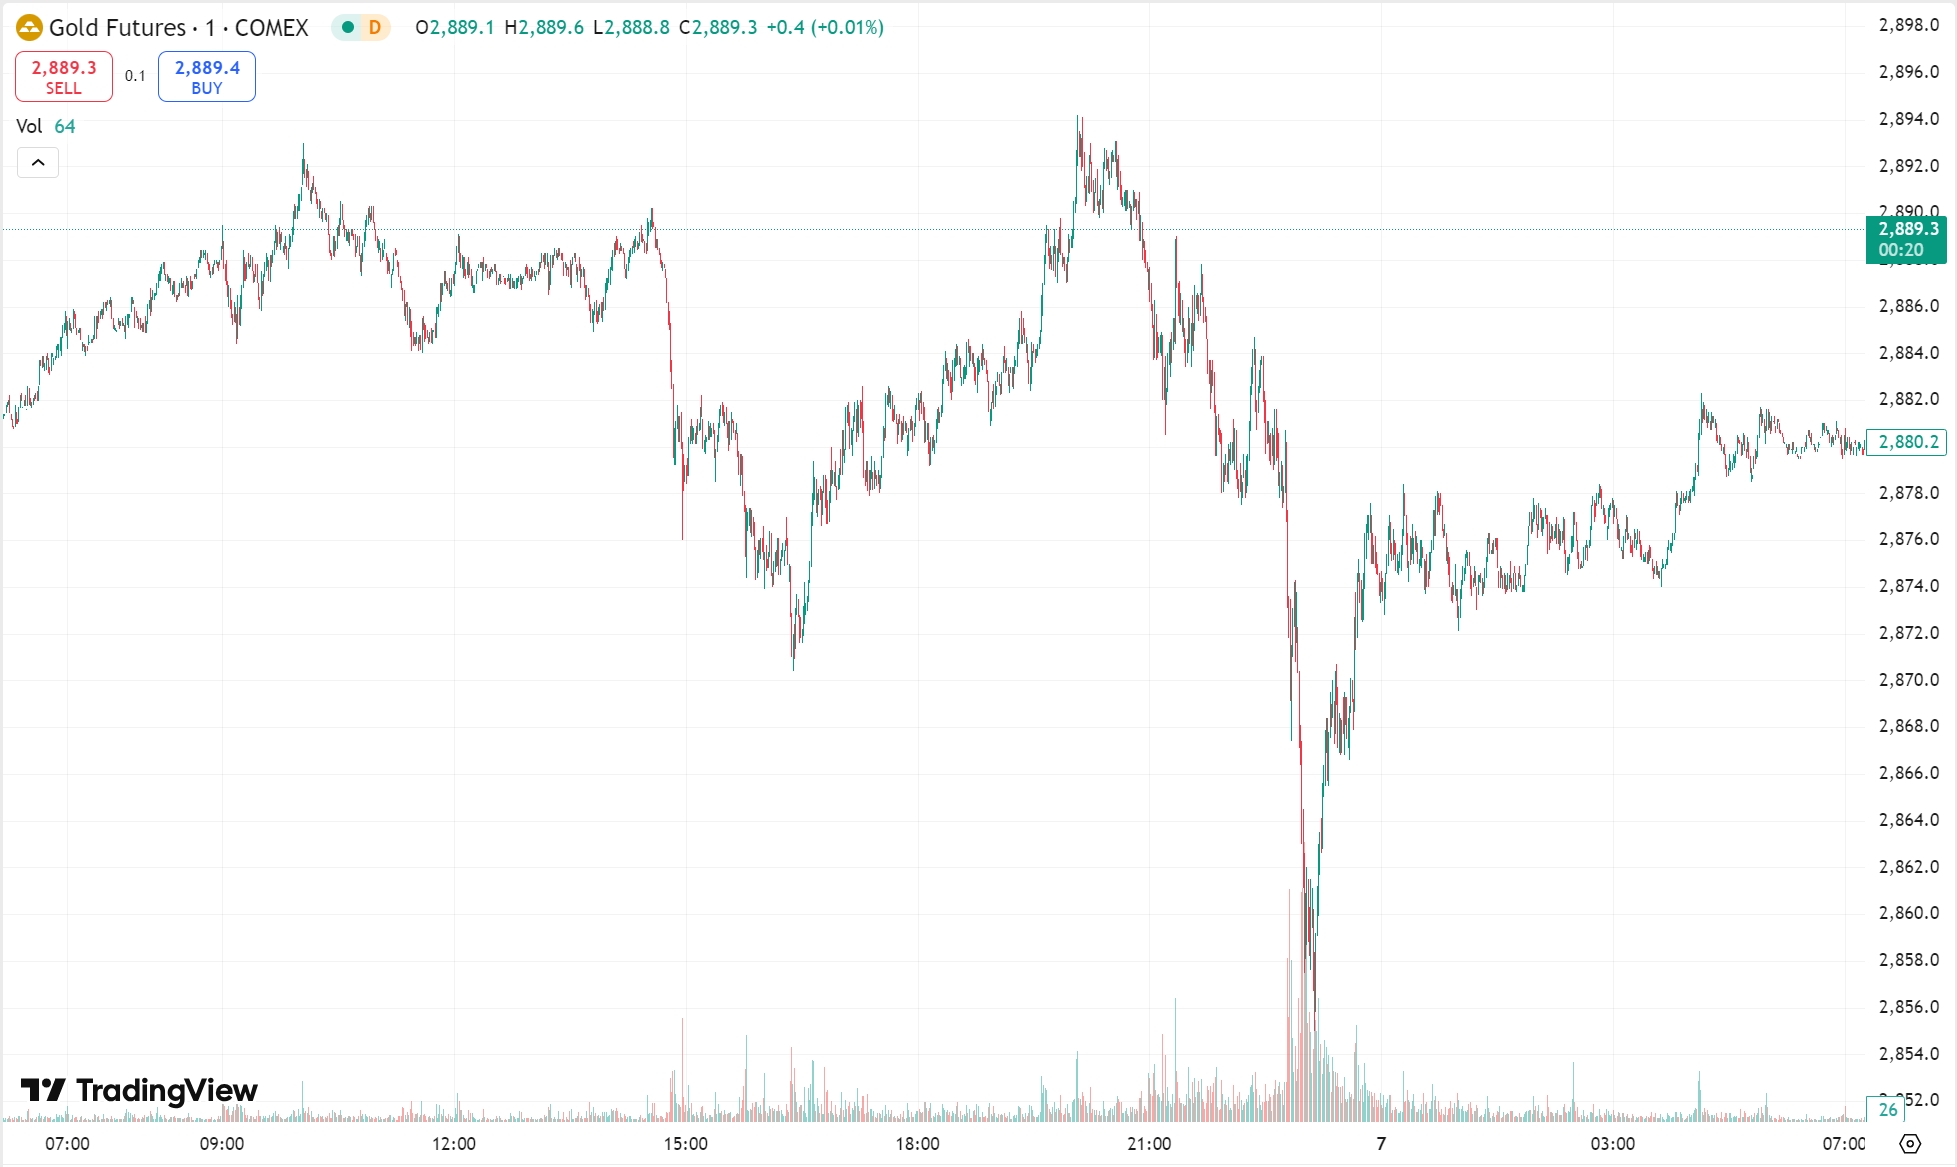
Today’s Focus – Gold
- Primary strategy: Buy on dips, sell on rebounds.
- Resistance Levels: $2,873–$2,878.
- Support Levels: $2,845–$2,840.
Oil Overview
Oil prices continued to decline on Thursday, weighed down by:
- Trump’s renewed pledge to boost US oil production.
- Surging US crude inventories, raising concerns about oversupply.
Oil Market Performance
- WTI Crude (March): – $0.42 (-0.59%), closing at $70.60 per barrel.
- Brent Crude (April): – $0.32 (-0.43%), closing at $74.29 per barrel.
Oil Market Drivers
- Saudi Aramco’s Pricing Decision:
- The oil giant raised March crude prices for Asian buyers, providing some support for oil prices.
- Trump’s Production Push:
- Speaking at the National Prayer Breakfast, Trump reaffirmed his commitment to ramping up US oil production.
- He announced that Interior Secretary Doug Burgum and Energy Secretary Chris Wright would work together to increase output, stating:”We will extract more liquid gold than ever before, and everything else will follow.”
- US Crude Inventories Surge:
- EIA data (Feb 6): US crude stocks surged 8.66 million barrels, far exceeding the expected 1.03 million barrels.
- Macquarie analysts predict another large increase in next week’s inventory report.
Technical Analysis – Oil
- WTI crude remained in a strong downtrend:
- US session: Oil failed to hold above $71.80, continuing its decline to close near $70.50, its daily low.
- Daily Chart: A bearish candle formed, with prices staying below the 5-day moving average, signaling continued downside momentum.
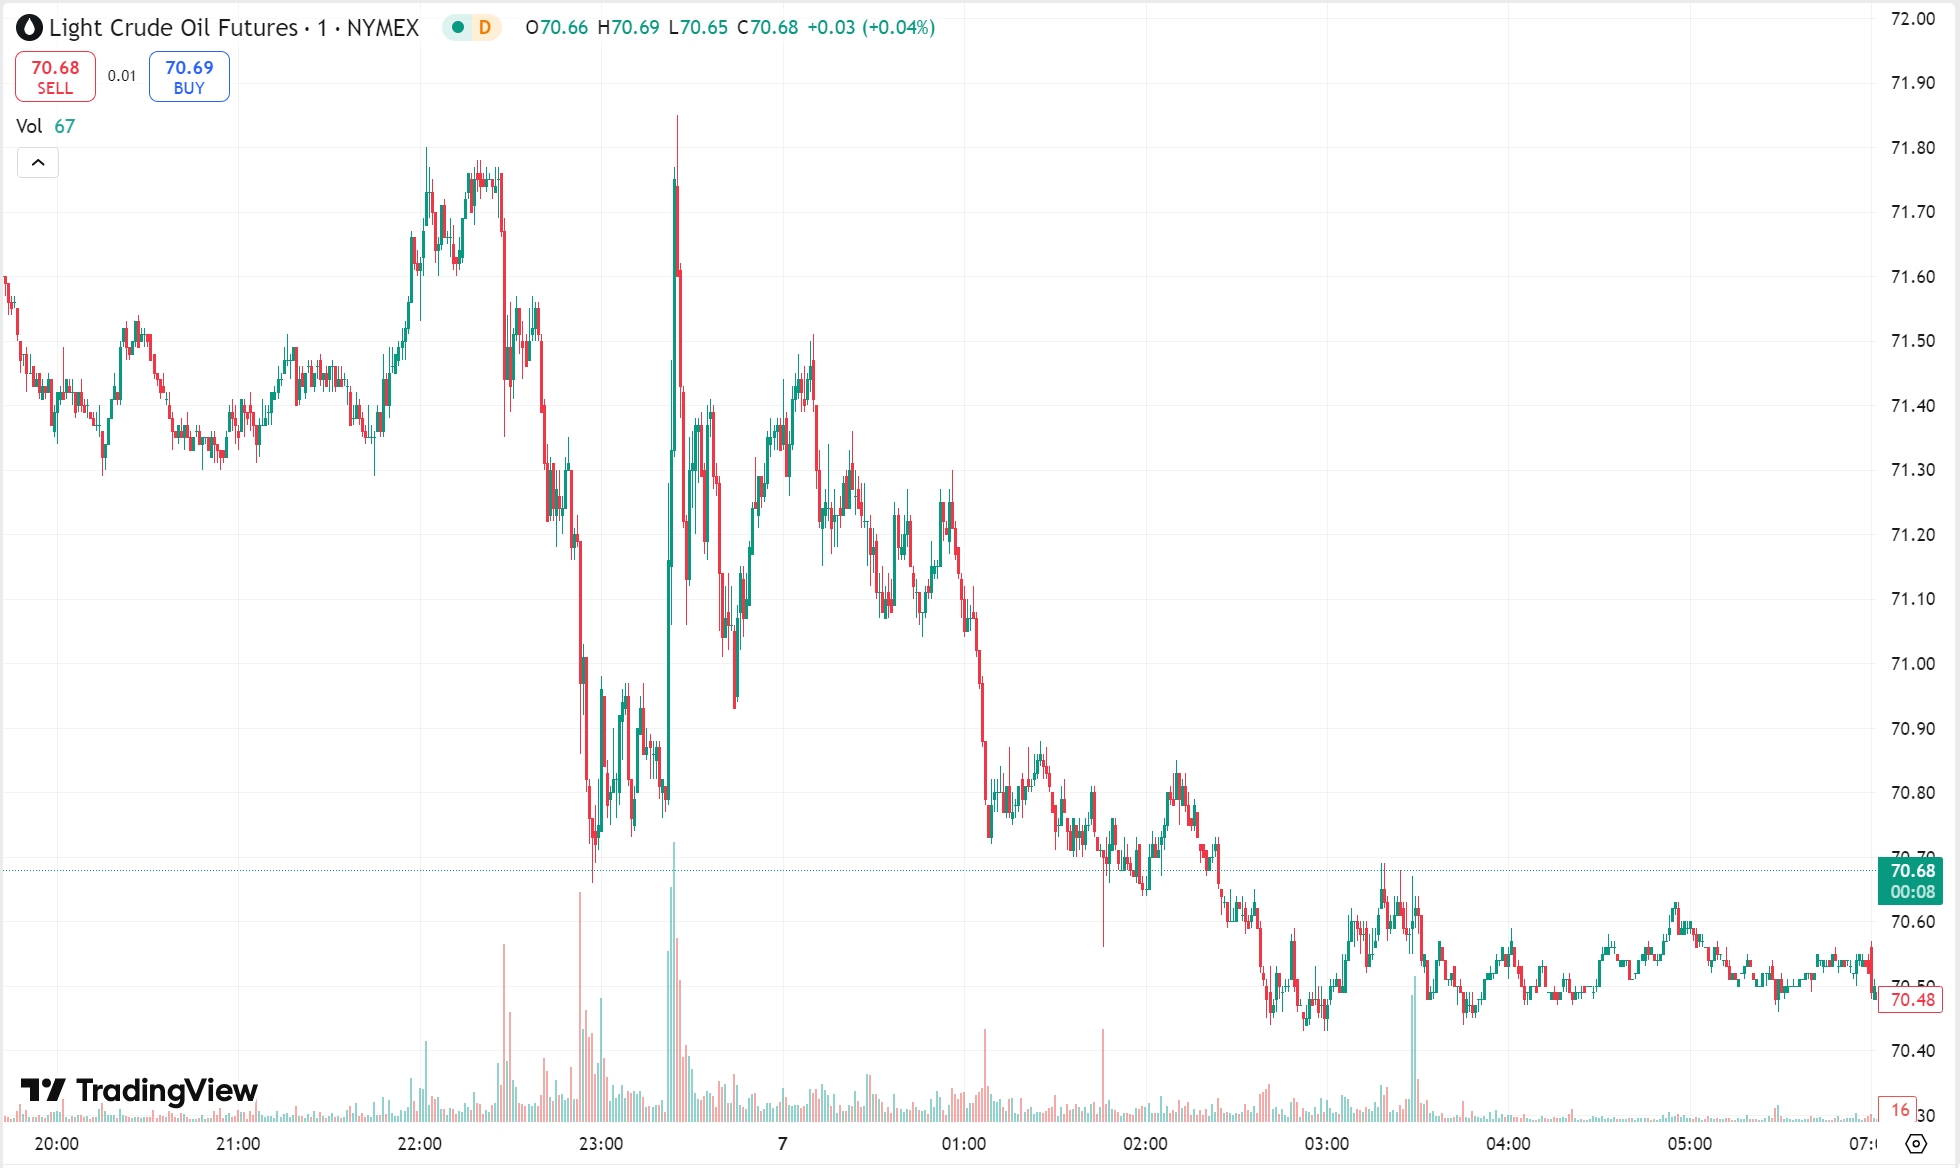
Today’s Focus – Oil
- Primary strategy: Sell on rebounds, with limited buying opportunities.
- Resistance Levels: $71.8–$72.3.
- Support Levels: $69.5–$69.0.
Risk Disclosure
Securities, Futures, CFDs and other financial products involve high risks due to the fluctuation in the value and prices of the underlying financial instruments. Due to the adverse and unpredictable market movements, large losses exceeding your initial investment could incur within a short period of time.
Please make sure you fully understand the risks of trading with the respective financial instrument before engaging in any transactions with us. You should seek independent professional advice if you do not understand the risks explained herein.
Disclaimer
This information contained in this blog is for general reference only and is not intended as investment advice, a recommendation, an offer, or an invitation to buy or sell any financial instruments. It does not consider any specific recipient’s investment objectives or financial situation. Past performance references are not reliable indicators of future performance. Doo Prime and its affiliates make no representations or warranties about the accuracy or completeness of this information and accept no liability for any losses or damages resulting from its use or from any investments made based on it.
The above information should not be used or considered as the basis for any trading decisions or as an invitation to engage in any transaction. Doo Prime does not guarantee the accuracy or completeness of this report and assumes no responsibility for any losses resulting from the use of this report. Do not rely on this report to replace your independent judgment. The market is risky, and investments should be made with caution.

