The intersection of politics and the stock market is a never-ending subject of interest, particularly during presidential election years. Investors, analysts, and traders often speculate on how election outcomes might influence market performance. To uncover potential patterns, we can examine the stock market returns during recent election years and explore whether these years follow any recognizable trends. Understanding these patterns can help investors strategically position their portfolios for the 2024 US elections.
Historical Context and Market Behavior
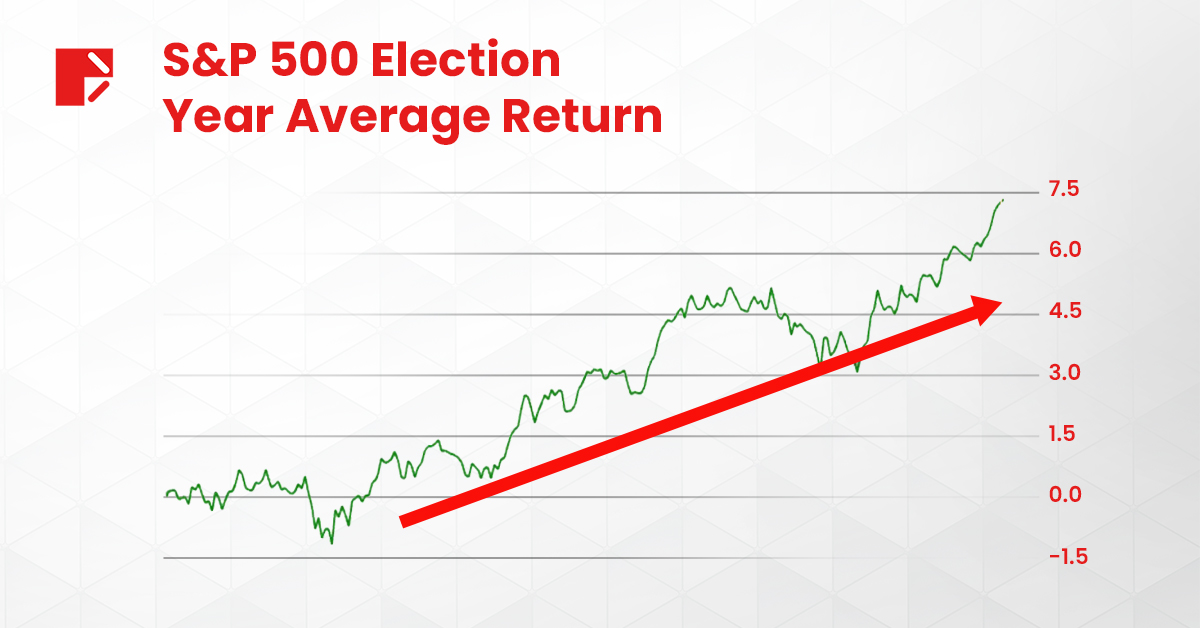
The concept of the “presidential cycle” suggests that stock markets tend to follow a predictable pattern based on the four-year presidential term. Typically, the second half of a presidential term, especially the third year, is seen as the most favorable for market performance. This theory is grounded in the belief that presidents, seeking re-election or aiming to solidify their party’s power, will implement policies to stimulate economic growth.
Let’s dive into the specifics of recent election years to see if they align with this cycle.
2016 Election: Trump vs. Clinton
The 2016 US presidential election, contested between Republican Donald Trump and Democrat Hillary Clinton, was marked by significant market volatility. Leading up to the election, uncertainty over the outcome created fluctuations in the market. On election night, as it became apparent that Trump would win, futures markets initially plummeted. However, the S&P 500 rebounded strongly the following day and continued to rally over 40% until 2018.
Market Performance:
- Pre-Election: The S&P 500 experienced volatility, reflecting market uncertainty.
- Post-Election: Following Trump’s victory, the market surged, driven by investor optimism over anticipated tax cuts, deregulation, and infrastructure spending.
2020 Election: Biden vs. Trump
The 2020 election was held amid the COVID-19 pandemic, adding an extra layer of complexity to market predictions. Democrat Joe Biden’s victory over Donald Trump was coupled with significant economic challenges due to the pandemic. Despite the uncertainty, the S&P 500 reacted positively after the election and rallied around 50%.
Market Performance:
- Pre-Election: The market showed volatility, influenced by pandemic concerns and election uncertainty.
- Post-Election: After Biden’s win, the markets surged, upbeat by optimism over potential stimulus packages and vaccine developments.
Comparing Patterns:
Analyzing these two election years reveals a few parallels:
- Pre-Election Volatility: Both elections saw increased market volatility in the months leading up to the election, driven by uncertainty over the outcome and potential policy changes.
- Post-Election Rally: Despite initial reactions, markets tended to rally following the election results. This rally was often fueled by investor optimism regarding future economic policies and stability.

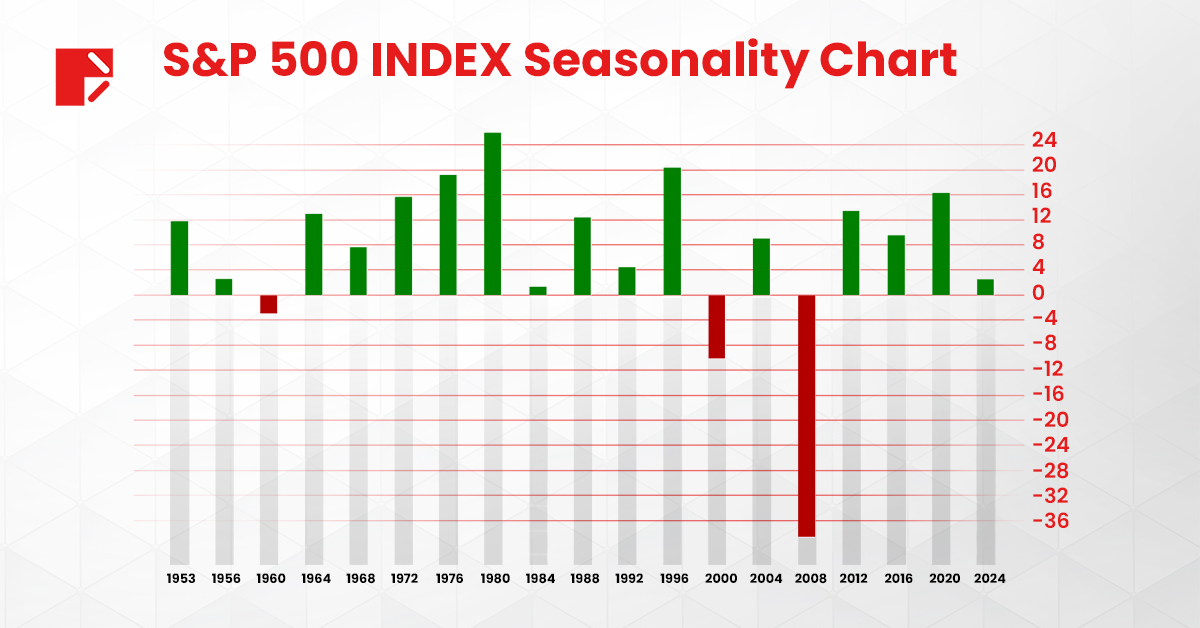
The stock market experienced negative returns only in the years 1960, 2000, and 2008, which were caused by recessions.
The Presidential Cycle and Market Returns
The broader presidential cycle theory suggests that the stock market tends to perform differently across the four years of a presidential term. Historically, the first two years might experience lower growth as new policies are implemented, while the third and fourth years often see stronger performance as the administration seeks to stimulate the economy.
Examining Recent Cycles
Obama’s Second Term (2012-2016):
- 2012 Election Year: The market showed resilience, with the S&P 500 ending the year positively. The re-election of Obama provided a sense of continuity, which the markets favored.
- 2013: A strong year for the market, aligning with the presidential cycle theory’s expectation of robust performance in the third year.
- 2014-2015: Continued positive market performance, though with increased volatility towards the end of 2015 due to various global economic concerns.
- 2016: As noted, significant volatility leading up to the election, followed by a post-election rally.
Trump’s Term (2016-2020):
- 2017: Marked by a strong market rally, driven by tax reform and deregulation efforts.
- 2018: A more volatile year, influenced by trade tensions and other global factors.
- 2019: Another strong year for the market, in line with the theory that the third year of a presidential term tends to perform well.
- 2020: High volatility due to the pandemic, but a significant post-election rally as noted.
Biden’s Term (2020-2024)
Joe Biden’s presidency has been characterized by significant policy shifts and market impacts, influenced by the ongoing recovery from the COVID-19 pandemic and geopolitical developments.
2021: Recovery and Stimulus
- The initial year of Biden’s term focused on economic recovery from the pandemic. The American Rescue Plan, a $1.9 trillion stimulus package, aimed to boost the economy by providing direct payments to individuals, extending unemployment benefits, and supporting small businesses.
- Market Impact: The S&P 500 saw substantial gains, closing the year up by approximately 27%. This was driven by the economic stimulus, vaccination rollouts, and investor optimism about economic recovery.
2022: Inflation and Rate Hikes
- Rising inflation became a central concern in 2022, with supply chain disruptions and high consumer demand contributing to price increases. The Federal Reserve responded by raising interest rates to fight inflation.
- Market Impact: The market experienced increased volatility, with concerns over inflation and rate hikes leading to fluctuations. The S&P 500 saw a decline, reflecting investor uncertainty about economic stability.
2023: Legislative Focus and Economic Stability
- Biden’s administration continued to push for significant legislative changes, including infrastructure investments and social spending plans. The Inflation Reduction Act aimed to address long-term economic issues and support green energy initiatives.
- Market Impact: The market showed signs of stabilization as inflation pressures eased and investor confidence improved. Key sectors such as technology and renewable energy received boosts from government policies,

Factors Influencing Election-Year Markets
Several factors can influence stock market performance during election years:
- Policy Uncertainty: Potential changes in fiscal, regulatory, and trade policies can create uncertainty, leading to market volatility.
- Economic Conditions: The overall economic environment, including factors like GDP growth, unemployment rates, monetary policy and corporate earnings, plays a crucial role.
- Global Events: External factors such as geopolitical tensions, global economic conditions, and unforeseen events like the COVID-19 pandemic can significantly impact market performance.
What about the Upcoming 2024 US Elections?
While there is no guaranteed pattern, recent election years suggest that markets often experience pre-election volatility followed by post-election rallies. This trend aligns with the broader presidential cycle theory, which suggests that certain periods within a presidential term are more favorable for market performance.
Investors should remain aware of the unique factors influencing each election and adopt strategies that account for potential volatility and policy shifts. By understanding historical patterns and maintaining a flexible approach, investors can better navigate the complexities of election years in the stock market.
Additionally, investors should tune in to watch the 2024 presidential debate between Biden and Trump, which will take place live on Thursday, June 27. This event can provide valuable insights into the candidates’ economic policies and their potential impact on the market.
Risk Disclosure
Trading in financial instruments involves high risks due to the fluctuation in the value and prices of the underlying financial instruments. Due to the adverse and unpredictable market movements, large losses exceeding the investor’s initial investment could incur within a short period of time. The past performance of a financial instrument is not an indication of its future performance. Investments in certain services should be made on margin or leverage, where relatively small movements in trading prices may have a disproportionately large impact on the client’s investment and client should therefore be prepared to suffer significant losses when using such trading facilities.
Please make sure you read and fully understand the trading risks of the respective financial instrument before engaging in any transaction with Doo Prime’s trading platforms. You should seek independent professional advice if you do not understand any of the risks disclosed by us herein or any risk associated with the trade and investment of financial instruments. Please refer to Doo Prime’s Client Agreement and Risk Disclosure and Acknowledgement Notice to find out more.
Disclaimer
This information is addressed to the general public solely for information purposes and should not be taken as investment advice, recommendation, offer, or solicitation to buy or sell any financial instrument. The information displayed herein has been prepared without any reference or consideration to any particular recipient’s investment objectives or financial situation. Any references to the past performance of a financial instrument, index, or a packaged investment product shall not be taken as a reliable indicator of its future performance. Doo Prime and its holding company, affiliates, subsidiaries, associated companies, partners and their respective employees, make no representation or warranties to the information displayed and shall not be liable for any direct, indirect, special or consequential loss or damages incurred a result of any inaccuracies or incompleteness of the information provided, and any direct or indirect trading risks, profit, or loss arising from any individual’s or client’s investment.
