
 Home
Home
Decoding The Santa Claus Rally
As the year comes to an end and the Christmas season approaches, a recurring phenomenon captures the attention of Wall Street and investors worldwide—the famed “Santa Claus rally”.
This market occurrence, as its name suggests, traditionally unfolds between Christmas and New Year’s. It signifies a period of stock market buoyancy, often characterized by a temporary surge in stock prices.
The rally is identified as a period where stock returns notably surpass the average returns observed during the rest of the trading days throughout the year. This surge primarily takes place in the final five trading days of December and extends into the first two trading days of January, fostering a temporary yet noticeable uptick in market performance.
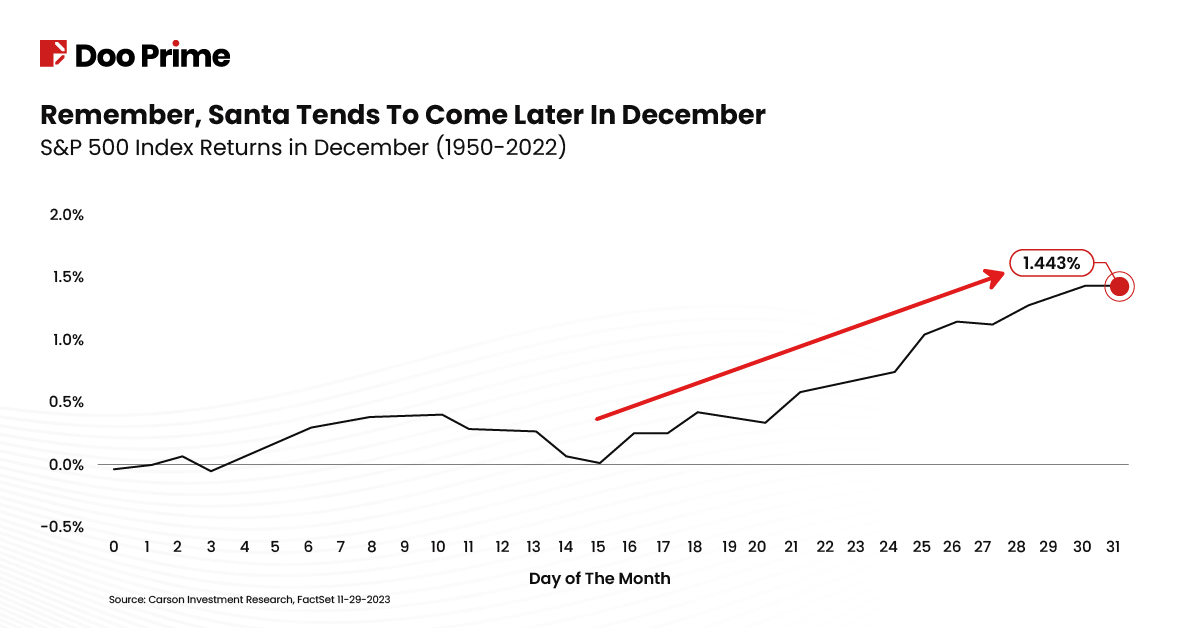
Image Source: Carson Group
Factors Affecting The Santa Claus Rally
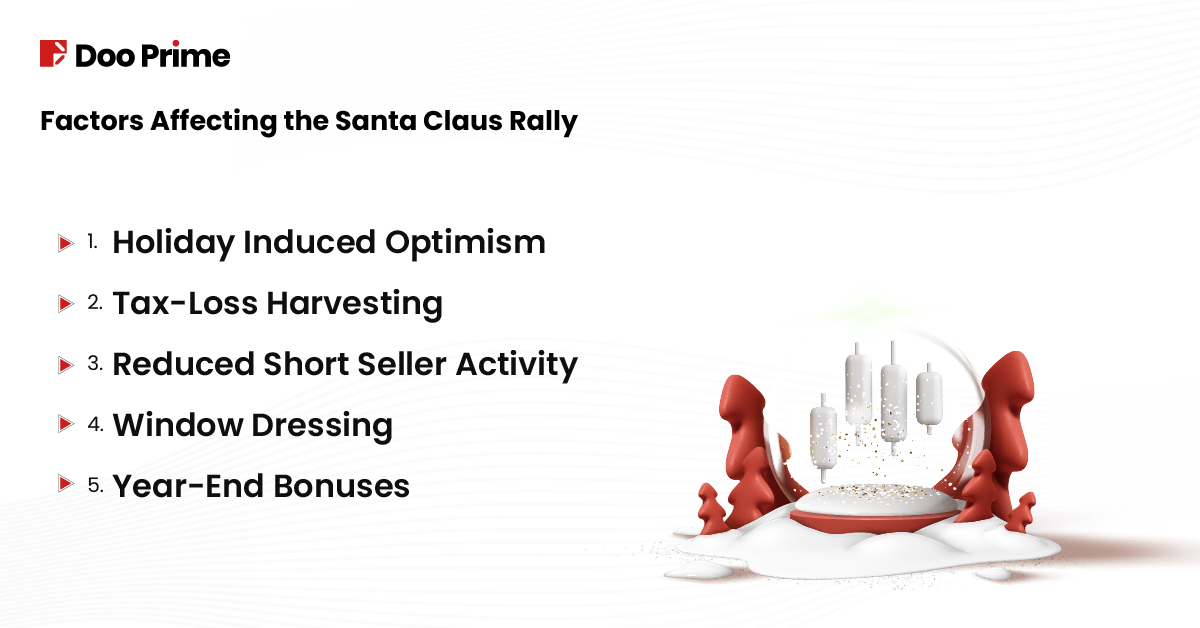
This market trend has persisted over the years. Yet, the precise origins of this market rally remain elusive, attributed to a variety of factors that coincide during the holiday season. The primary explanation is that holiday-induced optimism fosters a sentiment within the market, leading to increased investment activity.
Additionally, as the year-end approaches, investors make strategic portfolio adjustments due to tax considerations and the need to rebalance holdings, a practice called tax-loss harvesting. This period also sees a decrease in activity from short sellers as many key market participants take seasonal vacations, reducing selling pressure and potentially contributing to the temporary rise in stock prices.
The concept of ‘window dressing’ is also considered plausible. Some speculate that despite their reduced presence, institutional investors engage in ‘window dressing’ practices, strengthening their portfolios with shares of successful stocks to improve the overall appearance of their year-end reports. However, the specific impact of this practice on market movements during the Santa Claus rally remains uncertain.
Year-end bonuses and their effects on stock purchases adds as another layer. Corporations often distribute annual bonuses to employees, injecting additional funds into the market. While the timing of these bonuses varies among companies, the extra capital influx may contribute to the heightened market activity observed during this period.
Historical Patterns Of The Santa Claus Rally
Let’s look at the history of the Santa Claus rally throughout the years:
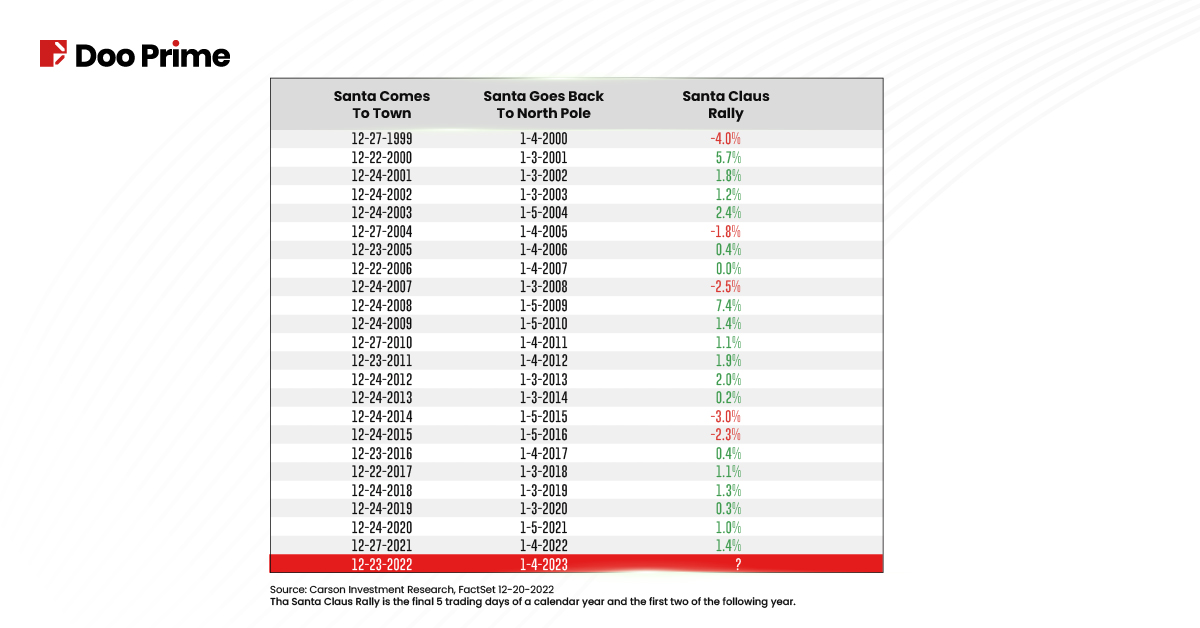
Image Source: Carson Investment Research
The Santa Claus rally was first defined in the 1972 Stock Trader’s Almanac by Yale Hirsch to describe the phenomenon of a sustained increase in the stock market during the last trading week of December and the first two trading days of the new year.
According to findings by The Wall Street Journal, major stock indices like the S&P 500, the Dow Jones Industrial Average (DJIA), and the Nasdaq Composite have tended to go up around 80% of the time during this period. On average, these indices have shown gains of about 1.3% for the S&P 500, 1.4% for the Dow, and 1.8% for the Nasdaq Composite during the Santa Claus rally.
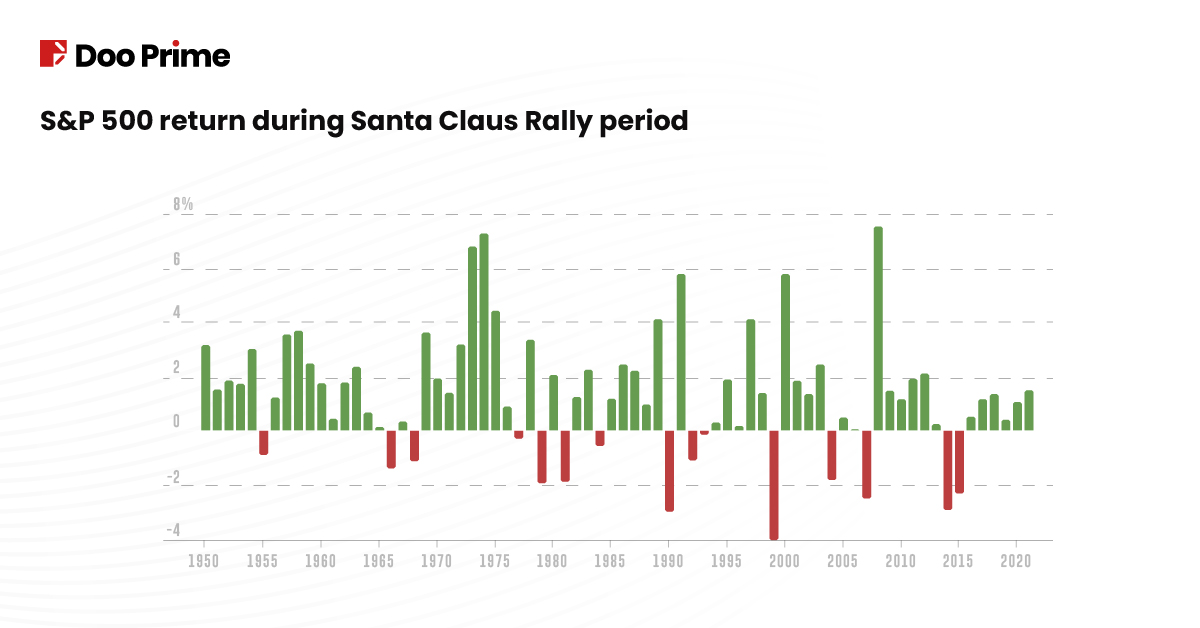
Image Source: Wall Street Journal
Over the years, the Santa Claus rally has been an event that typically marks a bullish streak. However, history illustrates notable exceptions, with years like 1990, 1999, 2004, 2007, and 2014 standing out as instances where the anticipated rally did not appear.
Remarkably, the absence of this rally in certain years led to significant market downturns. For instance, the failure of the rally in 1999 preceded a 33-month decline in the S&P 500, while the decline in 2007 initiated the second-worst bear market in modern history.
This historical pattern highlights the significance of the Santa Claus rally in market forecasting. It serves as an early indicator, offering insights into potential market trajectories in the early days of the upcoming year. As Yale Hirsch’s famously states: “If Santa Claus should fail to call, bears may come to Broad and Wall”. This statement emphasizes the rally’s predictive nature, making its presence or absence a crucial element in gauging market sentiment and potential future market performance.
Will The Santa Rally Happen In 2023?
As we approach the year-end, talks about whether the Santa Claus rally will grace 2023 are all around. Market analysts, economists, and investors are closely monitoring the market, evaluating various economic indicators, geopolitical events, and investor sentiment to gauge the probability of this phenomenon.
Overall, November emerged as the most promising month of the year, with tax selling wrapping up and the resurgence of corporate bids. Additionally, the U.S. election held in November has played a significant role in shaping market dynamics.
December has marked a positive start for U.S. stocks, notably characterized by the S&P 500 achieving a new record high on the first day of the month. This momentum aligns with historical data, showcasing December’s significance in the market. According to the CFRA, December stands as the S&P 500’s second-best performing month, averaging a 1.54% increase since 1945. Additionally, it holds the distinction of being the month most likely to yield gains, with the index recording a rise approximately 77% of the time, as per CFRA’s findings.
Notably, U.S. stock market valuations remain relatively reasonable, with the 12-month forward price-to-earnings ratio standing at 18.7x, aligning with the five-year average. However, these multiples slightly exceed the 10-year average of 17.6x, signaling a cautious sentiment.
Factors Investors Should Monitor This December
Looking ahead, these are several factors that could set the market landscape in December:
Inflation Data
The November inflation reading holds significance, arriving just ahead of the Fed’s December meeting. While October’s annualized CPI settled at 3.2%, the moderation in U.S. inflation, although not yet within the Fed’s target range, remains noteworthy. Additionally, energy prices’ recent decline has contributed to curbing inflation.
Fed Meeting and Rate Cut Speculation
The FOMC’s upcoming meeting on December 12-13 anticipates a steady rate stance, yet Chair Jerome Powell’s remarks on future interest rate directions will be closely scrutinized. Powell’s recent stance on rate cut speculation as ‘premature’ might evolve considering this final meeting of the year.
U.S. Economic Growth and Jobs Data
Despite concerns about a looming recession, U.S. economic growth has shown resilience. The December data on holiday shopping and job growth will offer insights into consumer sentiment and the economy’s health.
And if this year’s market does experience a Santa Claus rally, it will make it the eighth consecutive one for the index.
| About Doo Prime
Our Trading Products
Securities | Futures | Forex | Precious Metals | Commodities | Stock Indices
Doo Prime, an international preeminent online broker under Doo Group, strives to provide professional investors with global CFD trading products in Securities, Futures, Forex, Precious Metals, Commodities, and Stock Indices. At present, Doo Prime is delivering the finest trading experience to more than 130,000 clients, with an average trading volume of more than USD 51.223 billion each month.
Doo Prime entities respectively hold the relevant financial regulatory licenses in Seychelles, Mauritius, and Vanuatu with operation centers in Dallas, Sydney, Singapore, Hong Kong, Dubai, Kuala Lumpur, and other regions.
With robust financial technology infrastructure, well-established partnerships, and an experienced technical team, Doo Prime boasts a safe and secure trading environment, competitive trading costs, as well as deposit and withdrawal methods that support 20+ different currencies. Doo Prime also incorporates 24/7 multilingual customer service and extremely fast trade execution via multiple industry-leading trading terminals such as MT4, MT5, TradingView, and Doo Prime InTrade, covering over 10,000 trading products.
Doo Prime’s vision and mission are to become a financial technology-focused broker, streamlining international global financial products investment.
For more information about Doo Prime, please contact us at:
Phone:
Europe: +44 11 3733 5199
Asia: +852 3704 4241
Asia – Singapore: +65 6011 1415
Asia – China: +86 400 8427 539
E-mail:
Technical Support: [email protected]
Account Manager: [email protected]
Forward-looking Statements
This article contains “forward-looking statements” and may be identified by the use of forward-looking terminology such as “anticipate”, “believe”, “continue”, “could”, “estimate”, “expect”, “hope”, “intend”, “may”, “might”, “plan”, “potential”, “predict”, “should”, or “will”, or other variations thereon or comparable terminology. However, the absence of such terminology does not mean that a statement is not forward-looking. In particular, statements about the expectations, beliefs, plans, objectives, assumptions, future events, or future performance of Doo Prime will be generally assumed as forward-looking statements.
Doo Prime has provided these forward-looking statements based on all current information available to Doo Prime and Doo Prime’s current expectations, assumptions, estimates, and projections. While Doo Prime believes these expectations, assumptions, estimations, and projections are reasonable, these forward-looking statements are only predictions and involve known and unknown risks and uncertainties, many of which are beyond Doo Prime’s control. Such risks and uncertainties may cause results, performance, or achievements materially different from those expressed or implied by the forward-looking statements.
Doo Prime does not provide any representation or warranty on the reliability, accuracy, or completeness of such statements. Doo Prime is not obliged to provide or release any updates or revisions to any forward-looking statements.
Risk Disclosure
Trading in financial instruments involves high risks due to the fluctuation in the value and prices of the underlying financial instruments. Due to the adverse and unpredictable market movements, large losses exceeding the investor’s initial investment could incur within a short period of time. The past performance of a financial instrument is not an indication of its future performance. Investments in certain services should be made on margin or leverage, where relatively small movements in trading prices may have a disproportionately large impact on the client’s investment and client should therefore be prepared to suffer significant losses when using such trading facilities.
Please make sure you read and fully understand the trading risks of the respective financial instrument before engaging in any transaction with Doo Prime’s trading platforms. You should seek independent professional advice if you do not understand any of the risks disclosed by us herein or any risk associated with the trade and investment of financial instruments. Please refer to Doo Prime’s Client Agreement and Risk Disclosure and Acknowledgement Notice to find out more.
Disclaimer
This information is addressed to the general public solely for information purposes and should not be taken as investment advice, recommendation, offer, or solicitation to buy or sell any financial instrument. The information displayed herein has been prepared without any reference or consideration to any particular recipient’s investment objectives or financial situation. Any references to the past performance of a financial instrument, index, or a packaged investment product shall not be taken as a reliable indicator of its future performance. Doo Prime and its holding company, affiliates, subsidiaries, associated companies, partners and their respective employees, make no representation or warranties to the information displayed and shall not be liable for any direct, indirect, special or consequential loss or damages incurred a result of any inaccuracies or incompleteness of the information provided, and any direct or indirect trading risks, profit, or loss arising from any individual’s or client’s investment.